<iframe src="https://5923915.fls.doubleclick.net/activityi;src=5923915;type=hbx_core;cat=hbx_b0;dc_lat=;dc_rdid=;tag_for_child_directed_treatment=;ord=1;num=1?" width="1" height="1" frameborder="0" style="display:none">
HBX Business Blog

Ben Chowdhury

Ben is a member of the HBX Course Delivery Team and works on the Economics for Managers course for the Credential of Readiness (CORe) program. He has a background in economics and physics and enjoys card games, cooking, and discussing philosophy.

Recent Posts

Risky Business: Understanding How Insurance Markets Actually Work

Posted by Ben Chowdhury on June 27, 2017 at 4:12 PM

Toy house sitting on jenga blocks

How does insurance work and why is it so complicated? We will begin to answer these questions and more in a three part series on insurance markets.

Simply put, insurance is the business of buying and selling risk. In many situations, businesses and individuals are risk-averse. This means that they would prefer to pay some amount of money to reduce the amount of uncertainty in a situation.

For example, consider a simple coin flip game. If the coin lands on heads, you receive $100,000. If it lands on tails, you receive nothing. The expected value of your winnings is 50% * $100,000 + 50% * $0 = $50,000

Would you prefer to play that game, or just get a guaranteed $50,000?

Which would you prefer?
50/50 Game
$50,000
Survey Maker
 

Most people would prefer the guaranteed $50,000. What about $49,000?

Which would you prefer?
50/50 Game
$49,000
online surveys
 

If you would prefer $49,000 we consider you to be risk averse. You are willing to pay a premium of $1,000 to eliminate the uncertainty in this situation.

Of course, this is a somewhat frivolous example. Instead, let’s consider one of the oldest examples of insurance in the real world: property/home insurance. Modern property insurance goes back to shortly after the Great Fire of London. There was a desire among individuals to reduce the financial risk of losing their homes to fire. And companies (i.e. insurers) were founded to meet this need.

Let’s look at the economics behind this:

Let’s assume someone owns an apartment valued at $500,000 and that the insurer only offers one type of insurance, total insurance. Essentially this insurance will pay for any damage done by fire over the next 5 years.

The probability of loss over that time period is as follows:

  • 1% chance of total loss ($500,000 cost)
  • 2% chance of minor loss ($100,000 cost)

From the individual’s point of view, their expected loss is 1% * $500,000 + 2% * $100,000 = $7,000. Since the individual is risk-averse they are willing to pay at least $7,000 for the insurance policy, but let’s say the insurer charges around $10,000. This cost can be thought of as three parts:

  1. The actual expected payout to the individual = $7,000
  2. The risk premium (the cost to the insurer for having additional risk) = $500
  3. Overhead and administrative costs of providing insurance = $2,500

In this case, if the individual opts for the insurance coverage, they are willing to pay a $3,000 risk premium over the anticipated $7,000 in damages to insure against the risk of a greater loss. There is an important insight here: Insurers are better equipped to handle risk than individuals. As a result, that $500 risk premium the insurer faces is a lot lower than the $3,000 risk premium the individual is willing to pay. Why is this?

In fact, there are a number of reasons insurance companies can better handle risk (e.g. “floating” premiums until claims need to be paid), but the biggest reason comes down to simple probability.

Think back to the coin flip game from earlier. Imagine that the game is now a 50/50 chance at $10,000 and you get to play 10 times. The expected value is still $50,000. But now would you accept a guaranteed $49,000 over the game? Maybe not. That’s because by playing the game many times, you reduce the uncertainty. Since an insurance company can take on many customers, it can effectively reduce the amount of uncertainty it faces.

Below is a diagram showing the probability distribution of winnings in the coin flip game based on if you play once (individual) or if you play 10 times (insurance company). 

a diagram showing the probability distribution of winnings in the coin flip game based on if you play once (individual) or if you play 10 times (insurance company).

And now we can see what the graph looks like if the game is played 100 times. Here the insurance company would always get between $40,000 and $60,000. So that is very little risk compared to the 50/50 gamble the individual faces.

a diagram showing the probability distribution of winnings in the coin flip game based on if you play once (individual) or if you play 1000 times (insurance company).

This very simple result shows how insurance companies are able to manage risk, allowing them to create value which is passed on to consumers. Of course in practice, some (or all) of that value is lost due the overhead costs associated with insurance companies (but that is a much more complicated topic).

One key assumption we are making throughout this post is that insurance companies and individuals have the same information and are aware of how likely a “loss” is to happen. What happens when individuals know more about their potential for loss than the insurer does?

The next post in this insurance series will look at exactly that, and more generally the topic of adverse selection.


Interested in expanding your business vocabulary and learning the skills Harvard Business School's top faculty deemed most important for any professional, regardless of industry or job title?

Learn more about HBX CORe


About the Author

BlogRound_ben.pngBen is a member of the HBX Course Development Team and works on the Negotiation Mastery and Economics for Managers courses. He has a background in economics and physics and enjoys card games, cooking, and discussing philosophy.

Topics: HBX Insights

Why Airlines Overbook: Using Toy Models to Maximize Revenues

Posted by Ben Chowdhury on April 13, 2017 at 4:11 PM

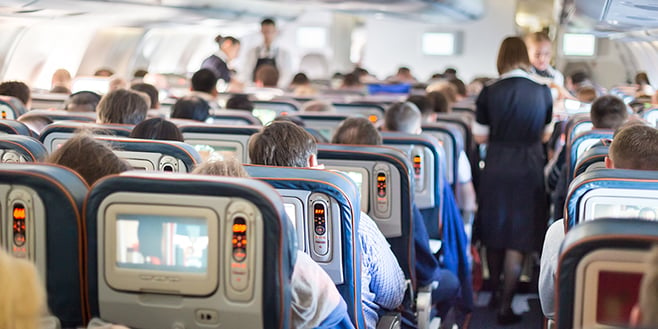
Full rows of passengers on an airplane

By now, we have all seen the recent news about United Airlines forcibly removing a doctor from an overbooked flight. Almost every major publication has a story on how various airlines handle overbookings and the rules and regulations that come with it (hint: United doesn’t fare so well), but  we wanted to look at the economics behind why airlines overbook.

At first glance, potentially having to pay as much as $1,350 in cash to remove a customer involuntarily from a seat that might have cost far less seems to go against the airline’s best interest. But if we take a more detailed look we can see why every airline overbooks to some extent.

What is a Toy Model?

In economics, we often construct “toy models." These are very simplistic mathematical models that look to explain some economic behavior or phenomenon. In this case, we are considering the revenue generated by a flight and how that revenue changes with varying levels of overbooking.

Let’s consider some of the variables that would go into this model, like:

  • Number of seats
  • Price of each seat
  • Likelihood that these seats will be bought
  • Probability that a customer does not show up
  • The cost of removing someone from a seat that is overbooked (may not be known)
  • How much money customers who do not show up to their flight get refunded
  • Type of flight (destination, length, etc.)
  • And many, many more 

Not only do we not know many of these variables, but our model would get hopelessly complicated. For right now, we want to simplify our model to just a few variables, so we are going to make some very important (and possibly unrealistic) assumptions:

  1. Every seat costs the same price
  2. All seats sell out
  3. The cost of removing someone from a flight is a constant value for each person
  4. Each individual has the same, known, probability of not showing up to a flight

With these assumptions we can create a very simple equation for the revenue of a particular flight.

At its most basic, Revenue = Price * Tickets Sold, where Tickets Sold is equal to the number of Available Seats plus the number of Overbooked Seats.

Cost of Overbooking

But then we have to account for the fact that if more people show up to the flight than there are seats available, the airline will have to pay some customers to leave the flight. We will call this the Cost of Removal. Airlines regularly offer up to $1,350 in cash to customers who are removed from flights. So the equation for the Cost of Overbooking looks like this:

Cost of Removal  * (Overbooked Seats – No-shows) = Cost of Overbooking

Cost of Refunds

Finally, we have to account for the fact that customers who do not show up to their flight are often given a refund of some sort. Maybe it’s 50% of their ticket price, although it could be more or less. So we have to calculate the following:

 Price * No-shows * Refund Rate = Cost of Refunds

Calculating Total Revenue

Given all these factors, we are left with the following equation:

Price * (Tickets Sold) - Cost of Overbooking - Cost of Refunds = Revenue

We can then plug numbers into this model to tell us how much revenue a flight will make. Then we simply pick the level of overbooking that makes the most revenue.

A key point here is that the number of no-shows is not a deterministic number, it varies and the airlines can never know exactly how many people will be no-shows. But since we know the probability that an individual will be a no-show, we can use that to create a distribution of how many no-shows we expect in total. For those of you interested, this would be a Binomial distribution.

Let’s put this model to the test:

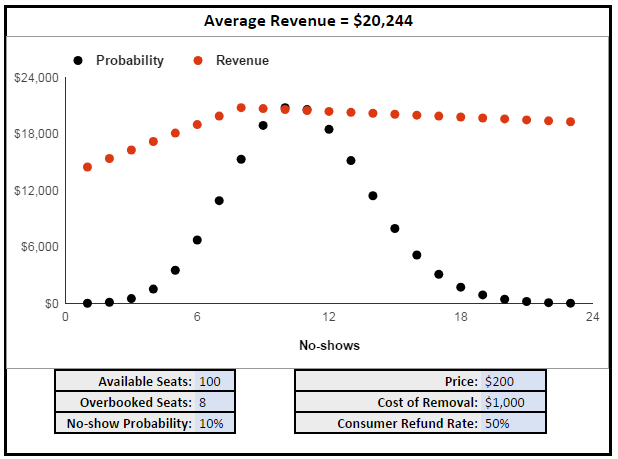
Graph showing how overbooked seats and no shows affect airline revenues

In the example above, the optimal number of overbooked seats for this flight is eight. If the airline were to increase or decrease that number, the average revenue would go down. For example, if the airline did not overbook at all, revenues would decrease to an even $19,000.

It turns out that even if we increase the cost of removal to something very high (say $100,000) it still makes sense for the airline to overbook (just to a lesser extent). Of course, this model doesn’t take into account other repercussions of overbooking and removing customers (like public relations scandals and impact on future demand for flights). This is a toy model after all!

Try It For Yourself

Feel free to adjust the numbers in the model to see how it affects the overall revenue and number of overbooked seats necessary to maximize profits.

The black data points represent the binomial distribution we talked about earlier, the probability that we will see a specific number of no-shows. The red data points represent the amount of revenue generated with that number of no-shows. The average revenue multiplies these values and adds them up. 


About the Author

BlogRound_ben.pngBen is a member of the HBX Course Development Team and works on the Negotiation Mastery and Economics for Managers courses. He has a background in economics and physics and enjoys card games, cooking, and discussing philosophy.

The Madden Curse: Real Phenomenon or Statistical Fallacy?

Posted by Ben Chowdhury on June 23, 2016 at 11:52 AM

football-player-2-to-1.png

Every year since 1999, the Madden NFL video game cover has featured an NFL star player from the previous year, similar to an athlete being featured on the Wheaties box. Fans have noticed a trend where these star players end up playing worse or even getting injured the following year. Hence the idea of a “Madden Curse,” and a subset of fans who are adamantly opposed to their favorite players being featured on the cover.

What does this have to do with statistics? Well, there is a concept in statistics called “reversion to the mean.” Reversion to the mean is the idea that if we observe an extreme event (e.g. a surprisingly strong NFL season), we can expect the following event to be closer to the average (e.g. the season following a particularly strong NFL season will be less impressive). This might explain why players featured on the Madden cover generally do worse the following year.

The player's reversion to the mean does not indicate that they are actually playing worse than they normally do, it’s just that we raised our expectations of them! We can look at a similar phenomenon at the team level. Historically, football teams that do very well (e.g. records of 14-2, 15-1, or 16-0) typically do worse the following season.

This concept relies on there being some randomness to the events. If an NFL season were purely the result of skill, then we would always expect the following season to be as good as the previous one (barring injury or other external factors). But as we all know, there is some luck (or randomness) involved in most human endeavors, and as a result we are all susceptible to reversion to the mean.

The good news is that reversion to the mean applies to extremely bad events as well. So, if you did particularly poorly on a recent exam (compared to similar exams you have taken), keep your spirits up because most likely you will do better on the next one!

Food for thought: Why do you think that when teams fire their coach, they usually improve? Does reversion to the mean play a role here? Can you think of any other situations where reversion to the mean plays a meaningful role? Let us know in the comments!

To learn more about the Madden Curse, check out this piece from Forbes.


Want to know more about statistics and other business concepts? HBX CORe will teach you the basics of Business Analytics, Economics, and Financial Accounting using Harvard Business School's renowned case-based methodology!

Learn more about HBX CORe


Ben

About the Author

Ben is a member of the HBX Course Delivery Team and works on the Economics for Managers course for the Credential of Readiness (CORe) program. He has a background in economics and physics and is interested in all things related to statistics and modelling human behavior.


Topics: HBX CORe, HBX Insights

The Power of Prediction Markets

Posted by Ben Chowdhury on April 14, 2016 at 10:23 AM

stock-exchange-2-to-1.png

Who do you think the next President of the United States will be? What about the winner of the 2018 World Cup? You probably have a guess, or at least a list of possible results. But no one actually knows for sure. 

Some situations have such complex dynamics that even think tanks and advanced modelling software have trouble understanding them. For example, imagine you are trying to estimate the box office results of an upcoming major film. You have some historical data on how similar films have done at the box office, but every film is different and is released in a different economic climate. You want to incorporate all of the various factors that affect the success of a film: advertising expenditures, the cast, demographic appeal, date of release, and so many other variables that you couldn’t possibly list them all, let alone measure them.

It turns out that one of the best predictors of box office results is the Hollywood Stock Exchange, or HSX. The HSX is a virtual market where anyone (you and I included) can sign up, get H$2 million in fake Hollywood dollars, and start betting on all kinds of Hollywood-related outcomes (e.g. Oscar nominations and box office results). The way it works is simple: The Jungle Book is currently selling for H$187.51 which means that the market expects The Jungle Book to earn $187.51 million in the first four weeks of its release. If I think The Jungle Book will actually make more than this, I can buy this MovieStock® at H$187.51 and then I can cash out my MovieStock four weeks after release for however much the actual box office earnings were (divided by $1 million and in Hollywood dollars). Just like a real stock market, the price of a MovieStock fluctuates with trading and I can always sell my MovieStocks for their current value before the cash out date.

The HSX is a great example of a prediction market. Prediction markets are markets where people can trade stocks that are tied to the outcome of an event. In a prediction market, the current trading value of a particular stock can be interpreted as what the public (or group of traders) collectively predict the outcome of the event to be. 

These prediction markets can be quite powerful. There is a significant amount of literature showing that HSX quickly absorbs new information (such as casting decisions) and accurately predicts box office results. HSX also has a history of correctly predicting Oscar nominations. There are dozens of prediction markets for events ranging from elections to sporting events with thousands of stocks being traded in real time. Many use real money and most are open to the public. While we don’t recommend “gambling” in these markets, we do recommend checking them out and thinking about their value and their limitations.


Want to learn more about prediction markets as well as other fundamental business topics?

Learn more about HBX CORe  

Topics: HBX CORe, HBX Insights

Is There a Place for Pollution Markets in the Modern Economy?

Posted by Ben Chowdhury on January 19, 2016 at 10:00 AM

pollution-cars-2-to-1.png

How much are you willing to pay for the right to pollute? If you drive into work like I do, maybe you would be willing to pay quite a lot. In reality, most individuals do not directly pay for the right to pollute. Instead we pay via the price of oil, coal, natural gas, and electricity.

In some cases individuals are paid to not pollute as with subsidies and tax rebates given to households that install solar panels as a form of clean energy. In light of the recent climate talks in Paris, we are taking a closer look at pollution markets and their role in today’s climate.

In many industries, the idea of paying for the right to pollute is increasingly prevalent. There is world-wide agreement on the need to limit pollution, specifically by reducing carbon emissions, but there is no such agreement on the policy or mechanism to do so.

One mechanism that has been used in the past is the creation of a pollution market, also known as cap-and-trade. In this system, companies are allotted a pollution allowance and then are allowed to trade those allowances with other companies. In this way, the market decides how much a pollution allowance is worth and distributes these allowances efficiently among all companies.

The major benefits of a pollution market are that the market creators, governments, or international organizations decide the total amount of pollution they wish to allow but do not have to figure out how to most efficiently distribute these allowances. Pollution markets have been in use since George H. W. Bush implemented them in 1990 to curtail sulfur dioxide emissions and the resulting acid rain.

More recently, there was a loud call from industry leaders for a cap-and-trade system to be discussed at the Paris climate talks. On the other hand, some argue that a cap-and-trade system is outdated and won't work in today's economy.

What do you think? You can read more at Marketplace here.

Topics: HBX CORe, HBX Insights

Time Is Money: What Would You Pay to Jump the Line?

Posted by Ben Chowdhury on August 20, 2015 at 9:55 AM

How long are you willing to wait in line for a meal at your favorite restaurant? Would you be willing to pay $30 to skip the line? How about $10?

Most people wouldn’t feel comfortable slipping money to a maître d’ at a restaurant to jump the queue, but a new app is testing whether patrons would be willing to donate the same amount of money to charity in order to be seated faster.

people-on-line-2-to-1

CharityWait is a feature from the restaurant hosting service app SmartLine that sets aside a few tables each night at restaurants that are designated “CharityWait tables”, making them available to parties who donate on a first-come, first-served basis. This way, not only can patrons avoid the wait, but there is also a reduced social stigma against paying to jump the line since the money goes to charity.

This strategy of allocating tables based on price, instead of the more typical restaurant seating model where tables are allocated through a queue system, is an interesting concept. In this scenario, all customers who are willing to wait in line will eventually get a table. However, customers who are willing to pay the fee will get seated faster.

It may be too early to say if this two-pronged approach will be a success in the restaurant industry, but other businesses have used it with good results. Take, for instance, Disneyland. You can pay the standard admission price and get access to all the park’s attractions. However, in order to experience everything, you’d have to stand in lines - lots of lines. But, by paying extra for Disney FASTPASS Service, you can bypass the queue and greatly reduce your wait time between rides.

Pricing allocation isn’t always popular, though. A good example is Uber, the car service app that connects users and drivers with the touch of a button. It is often praised by its users as a cheaper, more convenient alternative to taxis, but frequently draws criticism for its use of surge pricing. This practice incentivizes more drivers to come online and pick up fares when demand for rides is at its highest, like during rush hour, a blizzard, or after a sporting event gets out, by raising ride prices exponentially.  

Despite its clear purpose and seemingly sound economic model, this form of price allocation tends to leave a bad taste in peoples’ mouths. But what if Uber didn’t gouge prices and supply was kept constant in the face of increased demand? The users willing to pay for faster service would still be left waiting in the queue.

What do you think – will CharityWait do for the restaurant industry what the FASTPASS did for Disneyland? Or will it be like Uber and face allegations of price gouging?


Want to hone your business skills to help you advance in your career and feel more confident contributing to conversations about finance, economics, and business analytics?

Learn more about HBX CORe


Topics: Business Fundamentals, HBX CORe, HBX Insights