<iframe src="https://5923915.fls.doubleclick.net/activityi;src=5923915;type=hbx_core;cat=hbx_b0;dc_lat=;dc_rdid=;tag_for_child_directed_treatment=;ord=1;num=1?" width="1" height="1" frameborder="0" style="display:none">
HBX Business Blog

How to Minimize Biases in Your Analyses

Posted by Jenny Gutbezahl on June 13, 2017 at 1:58 PM

illustration of three people completing a survey

In statistics, we draw a sample from a population and use the things we observe about the sample to make generalizations about the entire population. For example, we might present a subset of visitors to a website with different versions of a page to get an estimate of how ALL visitors to the site would react to them. Because there is always random variability (error), we don't expect the sample to be a perfect representation of the population. However, if it's a reasonably large, well-selected sample, we can expect that the statistics we calculate from it are fair estimates of the population parameters.

Bias is anything that leads to a systematic difference between the true parameters of a population and the statistics used to estimate those parameters. Here are a few of the most common types of bias and what can be done to minimize their effects.

Bias in Sampling

In an unbiased random sample, every case in the population should have an equal likelihood of being part of the sample. However, most data selection methods are not truly random.

Take exit polling. In exit polling, volunteers stop people as they are leaving the voting place and ask them who they voted for. This method leads to the exclusion of those who vote by absentee ballot. Furthermore, research suggests the people are more likely to gather data from people similar to themselves.

Polling volunteers are more likely to be young, college educated, and white compared with the general population. It's understandable that a white college student will be more likely to approach someone who looks like they could be one of their classmates than a middle-aged woman, struggling to keep three children under control by speaking to them in a language the student does not understand. This means not every person has the same chance of being selected for an exit poll.

Bias in Assignment

In a well-designed experiment, where two or more groups are treated differently and then compared, it is important that there are not pre-existing differences between the groups. Every case in the sample should have an equal likelihood of being assigned to each experimental condition.

Let's say the makers of an online business course think that the more times they can get a visitor to come to their website, the more likely they are to enroll. And in fact, people who visit the site five times are more likely to enroll than people who visit three times, who are – in turn – more likely to enroll than people who visit only once.

The marketers at the online school might mistakenly conclude that more visits lead to more enrollment. However there is are systematic differences between the groups that precede the visits to the site. The same factors that motivate a potential student to visit the site five times rather than once may also make them more likely to enroll in the course. 

Omitted Variables

Often links between related variables are overlooked, or links between unrelated variables are seen, because of other variables that have an impact but haven't been included in the model.

For example, in 1980, Robert Matthews discovered an extremely high correlation between the number of storks in various European countries and the human birthrates in those countries. Using Holland as an example, where only four pairs of storks were living in 1980, the birth rate was less than 200,000 per year, while Turkey, with a shocking 25,000 pairs of storks had a birth rate of 1.5 million per year.

In fact, the correlation between the two variables was an extremely significant 0.62! This isn't because storks bring babies, but rather that large countries have more people living in them, and hence higher birth rates—and also more storks living in them.

Rerunning the analysis including area as an independent variable solves this mystery. Many other (more amusing) spurious correlations can be found at tylervigen.com. While it may not be possible to identify all omitted variables, a good research model will explore all variables that might impact the dependent variable.

Self-serving Bias

There are a number of ways that surveys can lead to biased data. One particularly insidious challenge with survey design is self-report bias. People tend to report salary and education as higher than reality, and weight and age as lower.

For example, a study might find a strong correlation between a good driver and being good at math. However, if the data were collected via a self-report tool, such as a survey, this could be a side effect of self-serving bias. People who are trying to present themselves in the best possible light might overstate both their driving ability and their math aptitude.

Experimenter Expectations

If researchers have pre-existing ideas about the results of a study, they can actually have an impact on the data, even if they're trying to remain objective. For example, interviewers or focus group facilitators can subtly influence participants through unconscious verbal or non-verbal indicators.

Experimenter effects have even been observed with non-human participants. In 1907, a horse named Clever Hans was famous for successfully completing complex mathematical operations and tapping out the answer with his hoof. It was later discovered that he was responding to involuntary body language of the person posing the problems. To avoid experimenter expectancy, studies that require human intervention to gather data often use blind data collectors, who don't know what is being tested.

In reality, virtually all analyses have some degree of bias. However, attention to data collection and analysis can minimize it. And this leads to better models.


Interested in expanding your business vocabulary and learning the skills Harvard Business School's top faculty deemed most important for any professional, regardless of industry or job title?

Learn more about HBX CORe


About the Author

Jenny G

Jenny is a member of the HBX Course Delivery Team and currently works on the Business Analytics course for the Credential of Readiness (CORe) program, and supports the development of a new course in Management for the HBX platform. 

Jenny holds a BFA in theater from New York University and a PhD in Social Psychology from University of Massachusetts at Amherst. She is active in the greater Boston arts and theater community, and she enjoys solving and creating diabolically difficult word puzzles.

Topics: Business Fundamentals, HBX CORe

How to Minimize the Margin of Error in an A/B Test

Posted by Jenny Gutbezahl on May 23, 2017 at 4:07 PM

A-B Test showing different content on two computer screens

Often when you encounter statistics in the newspaper, in a report from your marketing team, or on social media, the statistics will include a "margin of error." For example, a political poll might estimate that one candidate will get 58% of the vote "plus or minus 2.8%." That margin of error is one of the most important – and least attended to – aspects of statistics.

In statistics, error is any variability that can't be explained by a model. In mathematical symbols, we would say Y = f(X) + error. In words, we'd say, the dependent variable (what we're interested in predicting) is some function of other variables we're measuring, plus error. 

The reason this is called "error" is that when we create a statistical model, we use it to predict our dependent variable. For example, Amazon might run an A/B test where they randomly show a subset of their customers one version of a product page and the remaining customers a different version. They are trying to see if specific aspects of the page affect how much people spend on the product. In this case, Y is the amount spent, and X is the version of the page that they see. 

Perhaps, people who see the first page spend an average of $28, and people who see the second page spend an average of $35. If we know that someone saw the first page, and we know nothing else about him or her, our best guess would be that they spent $28. Any difference between what is actually spent and $28 is error (similarly, for people who see the second page, the difference between actual spending and $35 is error). 

We always expect some variability across the people in our sample, so we’d expect there to be SOME difference between the people who see the first page and the people who see the second, just by chance. If the errors are distributed in a predictable manner (usually in a bell-shaped curve, or normal distribution), we can estimate how much difference there should be between the two groups, if the page had no effect. If the difference greater than that estimate, we assume that difference is due to which page they saw.

Here are some of the things that contribute to error:

Variables missing from our model

There are a large number of variables that could influence spending, including: Time of year, the economic climate, individual information such as income, and computer-related issues, such as how they found the site and how fast the connection is. If these variables can be easily collected and added to the model, the model would still be Y=f(X) + error, but X would include not only the product page, but all the other information we have, which would likely lead to a better prediction. 

Actual mistakes

Maybe the person wants to buy two items, but accidentally hits 22. Oops! Or maybe the analytics engine was configured incorrectly or the dataset got corrupted somewhere along the way through human error or a technical problem.  You can minimize the effect of mistakes by taking time to review and clean your data

Misleading or false information

Maybe the person coming to the site is from a competing retailer, and has no intention of buying the product – they are just visiting the site to do research on the competition. While this source of error is relatively uncommon in behavioral data (such as purchasing a product), it is very common in self-report data. 

Respondents often lie about their behavior, their political beliefs, their age, their education, etc. You may be able to correct for this somewhat by looking for strange or anomalous cases and doing the same sort of cleaning you'd do for mistakes. You could also use a self-report scale that estimates various types of misleading information, such as this one.

Random or quasi-random factors

There are a number of factors that can lead to variability that are more or less random. Maybe the person is in a good mood, and so more likely to spend money. Maybe the model on one of the product pages looks like the shopper's 3rd grade teacher, who they hated, so they navigate away from the page quickly.

Maybe the person's operating system happens to update just as they are getting to the page, and by the time they reboot, they move on to other things. These things probably can't be built into the predictive model, and are difficult to control for, so they will almost always be part of the error.

Bias

So long as errors are basically randomly distributed, we can make a good estimate of how much money visitors will spend and how much this varies between versions. If we have a lot of random error, we may not be able to make a very accurate prediction (our margin of error will be large) but there's no reason it should be wrong one way or the other. 

However, systematic error leads to biased data, which will generally give us poor results. For example, if we decide to run one version of the product page for a month, and the other version the next month, the data may be biased based on time. If the first month is December and the second is January, or if there is a major change to the stock market toward the end of the first month, our comparison won't be valid. That's because the people who see the two pages differ systematically. 

Therefore, differences in spending between the pages are not due to random chance; some of that difference is due to bias. This makes it impossible to determine how much is due to the differences between the pages. The best way to address this is through good study design. Every single person who comes to the site should be equally likely to go to each page. 

It's never possible to completely eliminate error, but well-designed research keeps error as small as possible, and provides a good understanding of error, so we know how confident we can be of the results.


Interested in learning more about Business Analytics, Economics, and Financial Accounting? Our fundamentals of business program, HBX CORe, may be a good fit for you:

Learn more about HBX CORe


About the Author

Jenny G

Jenny is a member of the HBX Course Delivery Team and currently works on the Business Analytics course for the Credential of Readiness (CORe) program, and supports the development of a new course in Management for the HBX platform. Jenny holds a BFA in theater from New York University and a PhD in Social Psychology from University of Massachusetts at Amherst. She is active in the greater Boston arts and theater community, and she enjoys solving and creating diabolically difficult word puzzles.

Topics: Business Fundamentals, HBX CORe

How Do Companies Keep Track of Their Monies?

Posted by Christine Johnson on March 28, 2017 at 3:01 PM

accounting.png

From small mom-and-pop shops to multi-million dollar corporations, knowing who you’ve paid or who owes you is vital for a successful operation.

Here is an overview of how companies use accounting to keep track of their money.

process flow.jpg

Journal Entry

When a company has a transaction (i.e. buys a piece of equipment, sells inventory to a customer, etc.), they will record this transaction by creating a journal entry. The journal entry shows the date, the accounts that are involved with the transaction, as well as the amounts of money.

Below is an example of a journal entry. There are two accounts involved in this journal entry, Accounts Payable and Cash, and there are two amounts, $900 and $900. Notice that those amounts are the same—this should always be the case! Depending on the size of the company, there can be hundreds, thousands, and even millions of journal entries made each year!

journal entry.jpg

General Ledger

Have you ever heard the phrase ‘on the books’? This is referring to a company’s general ledger, which used to be a large, hand-written book containing all of the financial accounts of an organization. The general ledger is basically like the diary of a company, showing a chronological listing of transactions.

Below is an example of what a general ledger used to look like. Thankfully, most of this is done on computers now!

general ledger.jpg

Trial Balance

The trial balance contains a listing of a company’s financial accounts along with their balances. It’s a tool that helps check the clerical accuracy of transactions that have been recorded to date. As its name suggests, it’s a trial or a test to see if all of the entries add up, or balance, properly before creating the financial statements.

Financial Statements

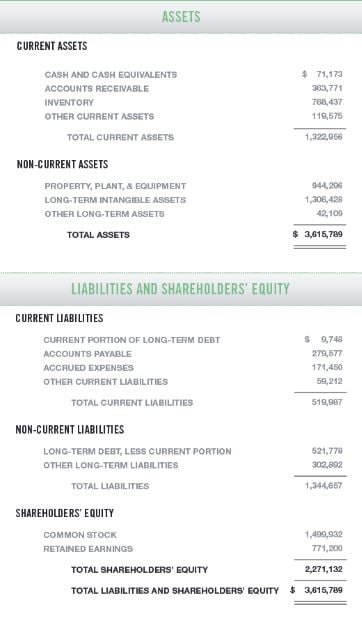
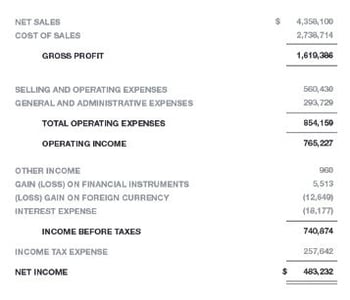
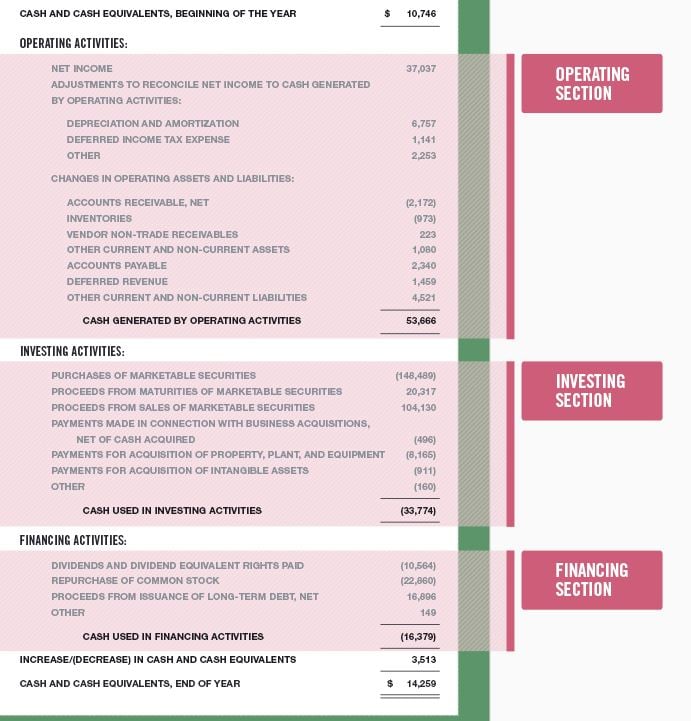
Financial statements are prepared reports that represent the financial operations of a company. They can be used internally by managers to make strategic decisions; they can be used externally by stakeholders to make investment decisions. The most commonly known financial statements are the Balance Sheet, The Income Statement, and The Statement of Cash Flows.

The Balance Sheet shows a company’s assets, liabilities, and shareholders’ equity for a given point in time (usually year-end).

balance sheet.jpg

The Income Statement summarizes the revenues and expenses over a given period of time (usually one year).

income statement.jpg

And, The Statement of Cash Flows summarizes a company’s cash flows related to operating, financing, and investing activities.

statement of cash flows.jpg

process flow.jpg

It can be helpful to think about this accounting process like a funnel. As we move down, the information gets less detailed and more concentrated.

funnel.jpg

Each of these processes play an important part in accounting and help businesses to understand, track, and improve how they earn and spend money.


Interested in learning the language of business? Take HBX CORe and discover the basics of Economics for Managers, Financial Accounting, and Business Analytics.

Learn more about HBX CORe


christine

About the Author

Christine is a member of the HBX Course Delivery Team, focusing on Financial Accounting and Disruptive Strategy. She holds a B.S. in Management from UNC Asheville, an M.S. in Accounting from Northeastern University, and an MBA from Northeastern University. In her spare time, she enjoys reading business journals and watching NFL games.

Topics: Business Fundamentals

What's In a Name? Two Common Accounting Terms That Do Not Mean What You Think

Posted by Christine Johnson on February 23, 2016 at 1:56 PM

calculator-2-2-to-1.png

We all know that accounting is nothing but number crunching. Accountants simply add numbers and subtract numbers while drinking copious amounts of coffee. Just kidding. Go hug your accountant or your closest accounting student, because accounting is a challenging process of measuring, validating, and reporting financial information for an entity.

Most would say that accounting is the language of business, and without it, you can’t talk the talk. Just like any language, there are words that cause great confusion for those learning it for the first time. Here are a couple of accounting terms that disgruntle fresh-faced accounting students (as well as established accounting professionals):

Deferred Revenue

You see the word revenue and automatically think, ‘REVENUE, REVENUE, REVENUE! Money is immediately coming my way!’ Put on the breaks there, pal. What if I told you that Deferred Revenue is actually a liability, an obligation to pay? You saw the word revenue, but did you happen to see that word in front of it—DEFERRED? This means that you can’t claim any revenue just yet. Some people find it helpful to use the word ‘unearned’ as opposed to ‘deferred’ to make it clear that the revenue isn’t yet realizable.

Unearned/Deferred Revenue is a liability account that represents the obligation to provide goods or services to a customer in the future. Unearned/Deferred Revenue is recorded when a business receives a payment in advance from a customer, but the business has not yet delivered the good or provided the service. Once the business fulfills its obligation to provide goods or services, the liability is reduced and the revenue is recognized. Say it with me, ‘Unearned/Deferred Revenue is not a revenue account!’

Prepaid Expense

You see the word expense and automatically think, ‘EXPENSE, EXPENSE, EXPENSE! Wait, wait, is this similar to Deferred Revenue? Where the word ‘prepaid’ makes the word ‘expense’ behave differently?’ Yes, you got it! Prepaid Expense is in fact NOT an expense account, but rather an asset account.

A Prepaid Expense is an asset that represents the right to receive goods or services in the future. Some common examples are prepaid rent or prepaid insurance, where a company pays for rent or insurance in advance of the coming month or year. At the time of the payment, the transaction is recorded as an asset, and as time passes, the asset is reduced and the expense is recognized. Say it with me, ‘Prepaid Expense is not an expense account!’


Want to learn the language of business and develop an essential understanding of financial accounting, business analytics, and economics for managers? You may be interested in HBX CORe, an interactive online program from Harvard Business School! 

Learn more about HBX CORe  

Topics: Business Fundamentals, HBX CORe, HBX Insights

5 Economic Relationships You Need to Know - Part 2

Posted by Patrick Healy on February 16, 2016 at 9:45 AM

bar-graph-2-to-1.png

Last week we featured part 1 of our list of economic relationships you need to know (found here). This week we are rounding out the list with three more key economic relationships:

  1. Interest Rates Up, Investment Up: How does a business, household or country determine how much money to invest? There are a lot of factors that go into that decision, but probably no other factor is as important as the prevailing interest rate. Interest is the money received for lending one’s money to another party (or, from the opposite perspective, the money paid to a lender for the right to borrow). The interest rate is then the ratio of money paid as interest to the amount lent/borrowed, usually quoted as a percent (so if you pay $5 to borrow $100, the rate is 5%). As an investor, you want to look for the highest possible rate of return for your money. Thus, the higher the prevailing interest rates in your country, the higher will be your incentive to invest your money. As a result, when interest rates increase (as they did in the US recently), investment will typically go up.
  1. Money Supply Up, Interest Rates Down: If interest rates determine investment, what determines interest rates? Well, in a way, the interest rate is the “price” of borrowing money and, in economics, prices are usually determined by quantities. Quantities of goods, quantities of services and, in the case of interest rates, the quantity of available money. Interest rates are largely determined by the supply of money in the economy. The more money there is available to firms and individual borrowers, the less banks and other lenders will be able to demand for the right to borrow that money. If a bank charges too much, potential borrowers can just go to another source to get money. This gives lenders the incentive to all charge around the same amount for access to that money. This relationship is what gives central banks so much power. A central bank, such as the U.S. Federal Reserve, has the legal right to print money and thus effectively controls the supply of money in the economy. If the Fed wants to stimulate the economy, like it needed to during the Great Recession, it can (effectively) lower interest rates by printing money, pumping money into the financial system and providing businesses the incentive to invest more. There’s more to it than that, but if you hear that the Fed plans to raise (lower) interest rates, just know that it’s doing so by decreasing (increasing) the supply of money.
  1. Economic Growth Up, Unemployment Down: As discussed, the amount of money in the economy plays a major role in determining interest rates. And interest rates largely determine how much businesses and households invest. Investment is crucial for a business to undertake new projects and be able to offer new products and services to consumers. But investment is only one part of the equation. To determine the overall “health” of an economy and the potential for individuals to buy their products, businesses also need to know how much domestic consumers, foreigners and the government are currently spending on goods and services. On the macro level, the amount spent on consumption, investment, government services and net exports (less imports) is known as gross domestic product (GDP). If spending on goods and services is not increasing (GDP is not growing) or has been decreasing (recession), it may not make sense for a business to bring a new product to market. And if that’s the case, businesses may not need as many workers to create such products. Thus, there exists a key link between GDP and unemployment. If GDP is growing, it’s more than likely that more workers are being hired to create products and services and thus unemployment will be declining.

Economics and finance is more complicated than the simple relationships described here, but these offer a rough depiction of how the decisions made by various actors play out in the real world to distribute resources and create an economy. As you hopefully see from these examples, economics and finance are largely influenced by human motivations. And by understanding humans, you just may be able to use those insights to improve your household, business or country.

Topics: Business Fundamentals, HBX CORe, HBX Insights

5 Economic Relationships You Need to Know - Part 1

Posted by Patrick Healy on January 28, 2016 at 8:38 AM

business-graph-2-to-1-1.png

What do you think of when you hear the word “economics” or “finance?” For many, words like these bring to mind complicated formulas and jargon, men in suits making irresponsible decisions with other people’s money, or bad memories of supply and demand graphs from college.

Fair enough. But economics and finance don’t need to be difficult. And you certainly don’t need to know a lot about either topic for you or your business to benefit greatly from them. Indeed, as a manager, employee, or policymaker, even a basic knowledge of economics and finance can be enough for you to make informed decisions that can result in increased profitability, smarter investment decisions, and better public policy.

Here’s a list of some key economic relationships for a business owner or policymaker to remember when making decisions:

  1. Price Up, Demand Down: This relationship is the foundation behind those pesky demand curves you may have had to draw in Econ 101, but is absolutely necessary for any business to understand in order to make money. Luckily, it’s pretty easy to comprehend, so we can skip the graphs altogether. Here’s the chase: when a business increases prices, it will almost always see sales for its product or service fall. This is because consumers prefer to pay less for something than more for it (but you probably didn’t need to be told that), so fewer people will be able to afford the good. Price up, demand down. It’s common sense.
  1. Price Up, Supply Up: This is the flipside to the previous relationship. When prices go up, consumers demand less, but, boy, would businesses sure like to supply more. Why would they not? If the product or service a business is supplying can command a higher price, it’s in the business’ best interest to supply more of it to make more revenue. So, price up, supply up. Like demand, its incentives at work here too.
Check out part 2 of our list here!

Topics: Business Fundamentals, HBX CORe, HBX Insights

iPhone 6S: Innovative or Disruptive?

Posted by Bryan Guerra on October 8, 2015 at 5:53 PM

iphone: disruption or innovation?

A product can be innovative without being disruptive: take the case of Apple's latest iPhone 6S release. 

With such new features as 4K video and 3D touch, this is a great example of a "sustaining innovation," as it builds upon pre-existing value networks and markets. 

People often refer to the iPhone as being “disruptive” – and they’re right – if they’re referring to the 2007 first generation release, which delivered laptop-type functionality for a fraction of the price. Since then, Apple has effectively “moved up” the value curve with sustaining innovations that continue to build higher levels of functionality.

So, is the Apple iPhone innovative? Of course. But that doesn’t mean it’s still disruptive.

To learn more about disruption versus innovation, check out HBX Disruptive Strategy.

Topics: Business Fundamentals, Disruptive Strategy, HBX Insights

4 Reasons Everyone Should Learn Basic Accounting

Posted by Christine Johnson on October 2, 2015 at 4:40 PM

When you tell your friends that you’ve signed up for an accounting class, you’ll likely get a reaction that sounds something like this: "Ugh, why?" Or, perhaps they will be slightly more sympathetic and say, "Oh, sorry to hear that."

Accounting gets a bad rap, but it's an incredibly useful subject to learn. Plus, it's not as complicated as you might think! Hear me out - here are four reasons why everyone can benefit from understanding basic accounting.

4 reasons everyone should learn basic accounting

1) So you don’t get ripped off!

Buying a car is a big investment. It can be overwhelming to try to negotiate a better price, so why not walk in with confidence, knowing you understand how a business like a car dealership is run and the ways you can get a better deal? If you’ve had an introduction to accounting, you’ll know that the car you’re about to buy is on the car dealer’s balance sheet as inventory. You’ll also know that in order to keep the car dealership operating, they must make a profit on the car (you can still talk ’em down; they don’t need that much profit).

Once you drive away, the car is taken out of the dealer’s inventory and payment received (cash or loan), as well as profit are recorded. You also know that most dealerships work on a monthly sales cycle and have quotas for the amount of inventory they need to turn over in the given time period. With this understanding, you can walk in at the end of the month, explain what you’re looking for, provide comps on similar cars at other dealerships, and walk out with a better price on your dream car (and probably the respect of the salesperson).  

2) So you aren't intimidated by your own finances.

Be honest, can you explain where all of your money goes after your paycheck gets deposited? Even if you’ve managed to find a job that pays the bills (collective sigh of relief from all of the parents out there), it can seem impossible to set aside money for savings each month. With some accounting knowledge under your belt, you will gain a much deeper understanding of what goes on with your own finances and learn important skills like how to effectively track expenses and work within a budget. 

Many people use the excuse that they are "no good at math" to explain their reluctance to study accounting, but the math actually involved is quite basic. If you can add and subtract, multiply and divide, you are set! With your new savings savvy, maybe you can save up enough to send your parents on a cruise as a thank you for the many years they supplemented your meager earnings!

3) So you can make better sense of current events.

There is no shortage of scandal in the accounting world. You’d be hard-pressed to turn on the news and not hear about a recent manipulation of numbers that has caused thousands of people to lose their shirts. Just like any industry, there will always be people who play by the rules and people who don’t. Why trust the media to fully explain what happened in an unbiased way? With a basic understanding of accounting, you can understand what these companies have done wrong and why it matters. You can even explain it to your friends and sound really smart at cocktail parties!

4) So you can impress your boss.

Picture this: You’re in a staff meeting and the CFO wants to discuss the past quarter’s financials. If you’ve had an introduction to accounting, you’ll not only be able to understand what the CFO is talking about, but you’ll also be able to chime in with your own financial wisdom and impress not only the CFO, but also your supervisor and all of your coworkers who are nodding their heads blindly and hoping no one calls on them.


Want to learn the language of business and develop an essential understanding of financial accounting, business analytics, and economics for managers? You may be interested in HBX CORe, an interactive online program from Harvard Business School! 

Learn more about HBX CORe  

Topics: Business Fundamentals, HBX CORe, HBX Insights

Monopoly Pricing: Can a 5,000% Price Increase Be Justified?

Posted by Patrick Healy on September 23, 2015 at 2:56 PM

hbx-monopoly-pricing-pharma

Who’s the most hated man in America? Well, if you’ve glanced at social media over the past day or two, the resounding answer seems to be Martin Shkreli.

Shkreli is CEO of Turing Pharmaceuticals, a US firm that acquired rights to Daraprim—a drug that treats toxoplasmosis, a parasitic affliction of many AIDS patients—back in August. Since then, the company has decided to raise the price of Daraprim from $13.50 per dose to $750.00 per dose—a price increase of over 5,000 percent! The pill costs about $1.00 to produce.

A former hedge fund manager, Shkreli originally defended his firm’s decision on the basis of profit considerations. So, is Martin Shkreli an evil guy, attempting to make a profit off of sick people that need his product? Maybe. But it’s more likely he just let monopoly power go to his head…

The backlash against the firm brings the idea of monopoly pricing out into the open. The decision of where to price a product is one of the toughest that a firm has to make. For a pharmaceutical company with complete pricing power over its product, it’s usually even more challenging. Aside from the production cost of pills, a drug company must also think about numerous other factors, such as pricing to recover the costs of research and development (R&D), patient willingness to pay, whether government insurance will pay a higher price, and others.

However, one factor that all companies must consider when deciding on a price is equity—is this a fair price to charge for a product that people need? Where Shkreli got it wrong is in severely underestimating fairness considerations when deciding where to price. And because he only focused on profits, he’s paying for it.

Read more about the controversy:

Topics: Business Fundamentals, HBX CORe, HBX Insights

(Im)Perfect Competition: Unrealistic Economics or Useful Strategy Tool?

Posted by Patrick Healy on September 22, 2015 at 2:16 PM

desert-island-2-to-1.png

There’s an old, near-funny joke about economists that goes something like this:

A physicist, a chemist and an economist are stranded on a desert island, with no food to eat. A can of soup washes ashore, but it’s sealed. So each professional ponders how to get it open…

“I’ve got it. Let’s smash the can open with a rock,” exclaims the physicist.

“No, no. The soup will splatter that way,” says the chemist. “Let’s build a fire and heat the can first.”

“You’re both wrong,” retorts the economist. “Let’s assume we have a can opener….”

The joke is corny at best. It may have even gone over your head. My apologies.

But the stereotypes in the joke are spot on, especially for the economist. One of the biggest gripes that people have with economists (and economics as a whole) is that the models that they build to represent the world often require unrealistic or even impossible assumptions in order to get results. What’s the point of building models that do not accurately represent reality?

One of the most cited examples of wishful thinking in economics is the model of perfect competition. Those of you that took Econ 101 in undergrad are (or at some point were) probably familiar with this idealist representation of how economic markets distribute goods and services. In short, perfect competition is a market condition in which no market participants (buyers, sellers, etc.) are powerful enough to set the price of a homogenous good or service.

competition-2-to-1.png

Economists expect markets to be perfectly competitive when the following conditions hold:

  1. Products are identical: sellers offer the exact same product and buyers are equally willing to buy from any seller.
  2. Many small price-taking participants: there are numerous buyers and sellers, none of which has the ability to influence the market price substantially, and no single firm or consumer accounts for a large portion of production or purchases.
  3. Perfect information: Buyers and sellers are fully informed about the quality of products and prices available in the market.
  4. Identical sellers: suppliers have full access to the same inputs and production technologies as one another.
  5. Free entry and exit: many new firms can enter the market on the very same terms as existing ones if the market is profitable and, similarly, firms can exit the industry without incurring extra costs.

Can you think of a market that satisfies these conditions? I certainly can’t… I myself used to be baffled at how strict its assumptions were. Models are supposed to be an accurate representation of reality, and this one certainly is not.

Conditions 1-3 above generate the equilibrium of a theoretical market. Firms will earn a profit at the market equilibrium if the market-clearing price is greater than the firms’ average total cost. But the presence of profits will entice more firms to enter, driving up production and pushing down prices until such competition and entry completely destroy profits. Products, prices, firms and consumers are all the same, so no one company can do anything about it. Perfect competition prevails leaving no profit.

Conditions 4-5 eliminate many of the market frictions experienced by real-world companies trying to enter or exit an industry. With all firms equally efficient and free to come and go as they please, competition is as intense as one can imagine. Since firms can leave, so no businesses make losses but none make money either. They simply break even. In this environment, one starts to question what’s so “perfect” about this form of competition. From a manager’s point of view, it’s hard to think of anything so far from ideal…

But when you look at it that way, I hope a lightbulb goes off for you. True, perfect competition is not a very useful model with which to classify modern industries today. But it’s a darn good one for a strategist to measure his or her firm against to see why and how their profit-making enterprises differ. To be clear, perfect competition is significant not because it is common (there are few to none of such markets in real life). Its real importance lies in the observation that departures from perfect competition are what underlie high profits and firms’ competitive advantages.

advantage-2-to-1.png

And for each departure from one of the model’s condition, firms have a chance to exploit attractive profit opportunities:

  1. Differentiated Products: in actuality, not all products are exactly the same, and thus some firms have the power to charge premiums for better quality or target different customer segments. A firm’s ability to create value for a customer through a differentiated product or service yields profits for the firm by being able to charge a higher price.
  2. Few, Price-Making Participants: actual markets are often dominated by a handful of powerful buyers or sellers that have substantial market power to move prices (the most extreme case being a monopoly who is the sole seller to a large number of buyers).
  3. Imperfect Information: in the real world, market information is far from readily available and buyers must spend time searching out reliable information. Buyers are often short on time and make decisions using cognitive shortcuts, not taking all information into account. So firms that can create customer loyalty will benefit greatly.
  4. Unique Sellers: some firms will ultimately have unequal access to production technologies and different input costs, making their overall costs structures very different. Firms with superior access to technology and cheap supplies can generate high profits even when the marginal firm earns no profits.
  5. Barriers to Entry and Exit: in reality, incumbent firms have certain advantages, such as prior experience, lower production costs, and others, that entrants cannot easily mimic, which discourages free entry into the industry. Similarly, exit costs may be substantially high, forcing loss-making firms to stay in the industry.

The sources of advantage above are by no means the only ones available to a firm, but encapsulate useful forces to think about when planning your firm’s strategy. Use them wisely and your firm will profit.

As I’ve argued before, economics is far from perfect and at times a bit idealistic. Models, like the theory of perfect competition, do not depict the state of affairs particularly well. Nonetheless, it’s sometimes the holes in economists’ models that provide the food for thought that can lead to a lasting business strategy or new innovation that changes an industry.

Topics: Business Fundamentals, HBX CORe, HBX Insights