

As we head into March, watercooler discussions naturally turn to the NCAA basketball championship and who's going to win the office bracket pool. The popular statistics site FiveThirtyEight has generated win likelihoods for all teams as they have in the past, but this year predictions are less certain than ever.
Even the top-ranked Villanova is given only a 15% chance of winning. As you may recall, last fall FiveThirtyEight garnered a lot of attention by being relatively uncertain about a Clinton win in the general election – this skepticism proved to be well-founded.
To make datasets more comprehensible, statistics summarize datasets with one or two numbers; this can obscure patterns. In college basketball, the entire complexity of a team's season performance can be reduced to the Rating Percentage Index (RPI), a ratio based on the team's wins and losses, and the strength of the teams played (based on those teams' wins and losses, and the wins and losses of the teams they played). Interested readers can find a fuller explanation, including the computational formula here.
Last year, Michigan State's impressive RPI of .6272 led to a No. 2 seed position. Middle Tennessee State on the other hand, with an RPI of .5562, was seeded at No. 15. And yet, on March 18, Middle Tennessee won 90-81 against Michigan State. Middle Tennessee turned out to be a Cinderella team; while it looked like they might end up as the belle of the ball, at the last moment, they choked and their carriage turned back into a pumpkin.
This year, Middle Tennessee is seeded as the underdog in the 12 spot, with a somewhat stronger RPI of .5960. Many pundits (though not FiveThirtyEight) are looking at them to do better than expected in the postseason, which would not be too unusual for a No. 12 Seed.
However, just looking at RPI (and last year's performance), may not provide enough information. While looking at all the specifics of a sports season, a national election, or a data distribution can be daunting, it is often necessary to do so if you want a full understanding of what's going on.
In 1973, the English statistician Francis Anscombe came up with an elegant way of demonstrating this. He created four data sets, each containing 11 data points with two values. In all sets the means and sample variances for the two variables are identical, as are the correlation between the two and the regression line predicting y from x:
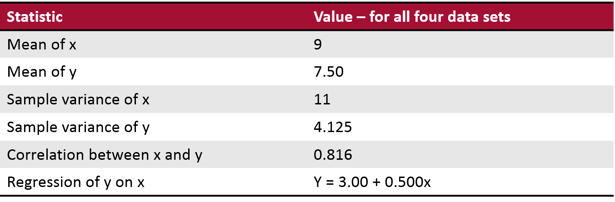
You'd think these four distributions would be pretty similar, with only minor differences due to random variability. You might also think that linear regression would be an effective model to help make predictions based on the data, in all cases.
But you'd be wrong. These are the four data sets:

The upper left graph shows a distribution which is about what we'd expect from the statistics, and the linear regression model is a good fit for this data set. The upper right graph clearly has a curvature. There's likely to be a great model for prediction, but it's NOT linear (the best model probably includes x2).
The two bottom models are more problematic. The one on the left shows a linear relationship – but that one outlier near the top is pulling the regression line away from the rest of the data. And the one on the bottom right is a real challenge. It looks as though, in general, x is a poor predictor for y. That is, almost all cases have an x-value of 8 and the y-values vary quite a bit, untethered to x. And one strange case, all by itself, is driving the entire model.
A similar situation exists in sports. Looking at summary stats for the season might make for a good model, or might overlook a non-linear relationship, or might be slightly (or greatly) misleading, due to a few unusual games, players, or plays, which may not translate to the post-season. That's why creating a bracket is so much fun!

About the Author
Jenny is a member of the HBX Course Delivery Team and currently works on the Business Analytics course for the Credential of Readiness (CORe) program, and supports the development of a new course in Management for the HBX platform.
Jenny holds a BFA in theater from New York University and a PhD in Social Psychology from University of Massachusetts at Amherst. She is active in the greater Boston arts and theater community, and she enjoys solving and creating diabolically difficult word puzzles.


