

In the two-week period following the 2016 election, the stock market rallied by 1.35%. Is this normal following a presidential election? We dug into the data to find out.
To do this, we tracked the closing value of the S&P 500 stock index on election day, then the closing value two weeks later, for a period from 1952 to 2016 (for 1952 to 1980, we used the last day the market was open before election day). Here are our results:
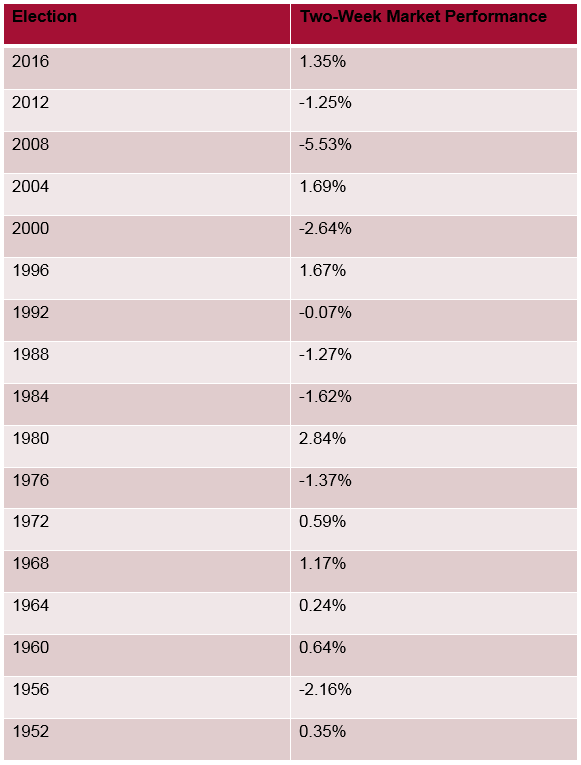
During the period, the average two-week performance of the market after the election of a Republican was 0.29%, and the average two-week performance of the market after the election of a Democrat was -0.81%.
What does this tell us? Well, for most elections, other than entertainment value, surprisingly little. The value of the stock market at any given time is a forward-looking measure, meaning that investors attempt to take into account all available information when making pricing decisions. That means that the likely outcome of an election has already been “priced in” to the market price. This is especially true in elections that aren’t especially close – a good example is 2008, for which the change in the S&P 500 is more likely related to prevailing market conditions (the worsening financial crisis) than any repricing of stocks based on a “surprise” election outcome.
The election of 2016, however, was a surprise outcome, and so we should expect that most of the price shift might be related to the reaction to the result. In this case, the market feels that Donald Trump’s policies will likely favor American businesses, leading to an increase in the value of those businesses by approximately 1.35%. This change in expectation is not uniform, however. Banks have done exceptionally well (Bank of America is up 7%; Goldman Sachs is up 6%; Citigroup is up 5%), which is likely a result of Republican promises to repeal the Dodd-Frank financial regulation; whereas gun-makers have fared much more poorly (Smith and Wesson is down 7%; Sturm, Ruger & Co is down 9%), as the market had expected consumers to “stock up” in the event of a Clinton election and is now pricing in lower future cash flows for these companies.
As in all things, stock prices are a constant game, with all participants trying to forecast future cash flows and determine what those cash flows are worth today. Incorporating new information – including events such as elections – is critical.Interested in gaining a toolkit for making smart financial decisions and the confidence to clearly communicate those decisions to key internal and external stakeholders?


About the Author
Brian is a member of the HBX Course Delivery Team and is currently working on the new Leading with Finance course for the HBX platform. He is a veteran of the United States submarine force and has a background in the insurance industry. He holds an MBA from McGill University in Montreal.


