<iframe src="https://5923915.fls.doubleclick.net/activityi;src=5923915;type=hbx_core;cat=hbx_b0;dc_lat=;dc_rdid=;tag_for_child_directed_treatment=;ord=1;num=1?" width="1" height="1" frameborder="0" style="display:none">
HBX Business Blog

Brian Misamore

Recent Posts

Creating Value: Amazon's Acquisition of Whole Foods

Posted by Brian Misamore on June 23, 2017 at 5:20 PM

vegetable display at a grocery store

On June 16, Amazon announced that they would be purchasing Whole Foods for $13.7 billion - approximately 27% higher than its current value in the market. After the initial shock wore off, many people began to speculate about whether this was a good decision or not.

In finance, we think about creating value as generating returns in excess of a firm's cost of capital - in other words, for projects and decisions to generate more cash flow over time than they cost today to implement, discounted back to the present.

That's a mouthful of a definition, but even the best projections can't necessarily help us understand if our decisions were successful. This is one place where the stock market – the crowdsourced opinions of thousands of analysts – can be of assistance.

Imagine a market value balance sheet; on the left side, the Assets side, are the market value of the firm's cash and their operating assets. On the right side, to balance, are the market value of the firm's debt and the market value of their equity. Now imagine that the firm makes an investment - they use $1 million dollars in cash and make a $1 million investment in a new asset. Accounting will shift the balance from cash to operating assets and show no change. But did the value of the firm change?

For this, we can look at the other side of the balance sheet - the financing side. Unless new debt is taken on as part of the project, the debt portion should stay the same. Which means that any decision that creates or destroys value for the firm will show up immediately in the market value of equity, which we call "market capitalization." The market capitalization tends to reflect the consensus opinion of decisions instantly, as all of those thousands of analysts respond to firm announcements in real time.

We can think of the purchase of Whole Foods as an investment decision - Amazon took a certain amount of cash and purchased an asset. Was that a value creating or value destroying decision?

In acquisitions, value creation comes from synergies, or ways in which the two companies together are worth more than they are individually. Sometimes, the acquiring company overpays for the acquisition, giving most or all of the synergies to their target. Sometimes they overpay by so much that they destroy value. So what about Amazon? How did they do?

For this, we can look at the market value of their equity. On Thursday, June 15, Whole Foods had a market capitalization of $10.6 billion and Amazon had a market capitalization of $460.9 billion. By the end of trading on Friday, Whole Foods' market capitalization was $13.7 (which makes sense, that's the price they were being acquired at) and Amazon's was $472.1 billion.

That means that the market thinks this acquisition created $14.3 billion in value through synergies (the total combined increase across the two companies) and the synergies were split up by giving $3.1 billion to Whole Foods shareholders and $11.2 billion to Amazon shareholders. 

Clearly, the market felt this was a really good decision (and the market capitalizations of the two companies continued to rise over the next week). In fact, since the synergies at $14.3 billion are more than the purchase price of Whole Foods at $13.7, it can be said that the market thinks Whole Foods is worth twice as much as part of Amazon than it is alone. That's incredible - and it's how the market consensus can tell firms, instantly, whether their decisions created value.


Want to better understand finance? Interested in developing a toolkit to make smarter financial decisions? Learn more about the HBX course, Leading with Finance.

Learn More


About the Author

Brian.png

Brian is a member of the HBX Course Delivery Team and was the lead content specialist for the HBX Leading with Finance course. He is currently working to build courses on entrepreneurship, management, and corporate social responsibility. He is a veteran of the United States submarine force, has a background in the insurance industry, and holds an MBA from McGill University.


Topics: HBX Finance

How to Price a Bond: Breaking Down the Financial Jargon

Posted by Brian Misamore on June 2, 2017 at 3:25 PM

AdobeStock_66342289-056653-edited.jpeg

In finance, we say that the value of something today is the present value of its discounted cash flows. We use this to value everything, and finance courses (like ours) give examples of valuing projects and businesses.

What is a Bond?

A bond is a debt investment in which an investor loans money to an entity (typically corporate or governmental) which borrows the funds for a defined period of time at a variable or fixed interest rate. Bonds are used by companies, municipalities, states and sovereign governments to raise money and finance a variety of projects and activities. Owners of bonds are debtholders, or creditors, of the issuer.

Source: Investopedia.com

But what about bonds?

Turns out, bonds can be valued exactly the same way. Bonds, however, can be a bit obscured by finance jargon, so we'll need to break through a bit to figure out their value. 

Let's take an imaginary bond: it has a face value of $1000, an annual coupon of 3%, and a maturity date in 30 years. What does all that mean?

What is means is that the company or country that owes the bond will pay the bond holder 3% of the face value of $1000 ($30) every year for 30 years, at which point they will pay the bond holder the full $1000 face value.

That gives us our cash flows. We have a series of 30 cash flows, one each year of $30, and then we have one cash flow, 30 years from now, of $1000.

Now we need to use our discounting formula:

Cash Flow ÷ (1+r)t

We have the cash flows and we have the number of years for each of them (called "t" in that equation). We need the "r", which is the interest rate. Which should we use? What we do is we use the current interest rate for similar 30-year bonds today. Since we're making up these numbers for the purpose of this example, it doesn't really matter what we use - we can say it's 5%.

So now we can value the various cash flows. First, we have the coupon payments:

30 ÷ (1+.05)1 + 30 ÷ (1+.05)2... + 30 ÷ (1+.05)30

And then we have the final face value payment, in thirty years:

1000 ÷ (1+.05)30

Together, these total the price - $692.55. This price will ensure that the bond holder receives an annual return of 5% over the life of the bond.

Now that we have our price, we can play with some of our assumptions to see how things change. What if the prevailing market interest rate were 4% instead of 5%? In that case, the price of the bond would be $827.08. If it were 6% instead of 5%, the price would be $587.06. So, one thing to remember is that the price of a bond is inversely related to the interest rate - when interest rates go up, the price of bonds goes down, and vice versa. When the price of the bond is beneath the face value, we say that the bond is "trading at a discount." When the price of the bond is above the face value, we say the bond is "trading at a premium."

This can be important if you don't want to actually own the bond for 30 years. If you want to hold the bond for 5 years, then you'd receive $30 per year for 5 years, and then you'd receive that price of the bond at that time, which will depend on the current interest rates at the time. This is why, while some long term bonds (like government Treasury bonds) can be considered "risk free" over their full lifetime, they will often vary a great deal in value on a year-to-year basis.


Want to better understand finance? Interested in developing a toolkit to make smarter financial decisions? Learn more about the HBX course, Leading with Finance.

Learn More


About the Author

Brian.png

Brian is a member of the HBX Course Delivery Team and was the lead content specialist for the HBX Leading with Finance course. He is currently working to build courses on entrepreneurship, management, and corporate social responsibility. He is a veteran of the United States submarine force, has a background in the insurance industry, and holds an MBA from McGill University.

Topics: HBX Finance

Exploring Company Valuation: Tesla, Ford, and GM

Posted by Brian Misamore on April 21, 2017 at 10:38 AM


Green electric car parked at a charging station

Earlier this week, we analyzed reports of Tesla's market capitalization passing both Ford Motor Company and General Motors, and found that these eye-catching headlines can mostly be explained by the different capital structure of Tesla compared to its older rivals.

Today, we’re taking things a step further and discussing why Tesla might be valued so highly, despite being a very small company. To do this, we’ll need to look at the ratio of Enterprise Value (a finance term meaning the total operational value of the company) to EBITDA, an acronym for Earnings Before Interest, Taxes, Depreciation and Amortization.

EBITDA

When examining earnings, financial analysts generally don't like to look at the raw net income profitability of a company because it's manipulated in a lot of ways by the conventions of accounting, and some of them can really distort the true picture.

To start with, the tax policies of a country seem like a distraction from the actual success of a company - they can vary across countries or across time, even if nothing actually changes in the operational capabilities of the company. Second, Net Income subtracts interest payments to debt holders, which can make companies look more or less successful based solely on their capital structures. That doesn't seem to make sense - so we add both of those back to arrive at EBIT (Earnings Before Interest and Taxes), which we call operating earnings.

Next, we look at depreciation and amortization. In normal accounting, if a company purchases equipment or a building, it doesn't record that transaction all at once - it charges itself an expense called depreciation over time. But the company isn't really spending any money on that depreciation; it isn't real. Amortization is the same thing as depreciation, but for things like patents and intellectual property; once again, no actual money is being spent on this expense.

In some ways, then, depreciation and amortization can take the earnings of a rapidly growing company look worse than a declining company, and that's definitely not right. This sort of distorted picture especially happens to companies like Amazon and Tesla.

Now that we understand how we arrive at EBITDA for each company, we can look at these ratios.

According to the Capital IQ database, Tesla has an Enterprise Value to EBITDA ratio of 36x. Ford's is 15x, and GM's is 6x. So what do these ratios mean?

Present Value of a Growing Perpetuity Formula

One way to think about these ratios is as a part of the growing perpetuity equation. A growing perpetuity is a kind of financial instrument that pays out a certain amount of money every year, and that amount of money grows each year as well. Imagine an annual stipend for retirement that needs to grow every year to match inflation. The growing perpetuity equation allows us to find out today’s value for that sort of financial instrument. Here’s the equation:

Value = Cash Flow / (Cost of Capital - Growth Rate)

So, in our retirement example, someone who wanted to receive $30,000 every year, forever, with a discount rate of 10% and an annual growth rate of 2% (to cover expected inflation) would need $375,000 [30,000/(10%-2%)]. That’s the present value of that arrangement.

What does this have to do with companies? Well, we can imagine the EBITDA of a company as a growing perpetuity paid out every year to the capital holders (both debt and equity) of the company. If a company can be thought of as a stream of cash flows that grow each year, and we know the discount rate (which is that company’s cost of capital), we can use this equation to quickly value the enterprise value of a company.

To do this, we’re going to need some algebra to convert our ratios to this formula. Let’s take Tesla, with an Enterprise to EBITDA ratio of 36x. That means the Enterprise Value of Tesla is 36 times higher than its EBITDA. 

If we look at the growing perpetuity formula and use EBITDA as the Cash Flow and Enterprise Value as the value we’re trying to solve for in this equation, then we know that whatever we’re dividing EBITDA by (the Discount Rate – Growth Rate) is going to have to give us an answer that is 36 times what we have in the numerator. 

Enterprise Value = EBITDA / (1/RATIO)

In other words, the denominator needs to be 1/36, or 2.8%. If we repeat this example with Ford, we would find a denominator of 1/15, or 6.7%. For GM, it would be 1/6, or 16.7%.

The Power of Growth

Plugging it back into the original equation, we know that the percentage is equal to the Cost of Capital - Growth Rate, so we could imagine that Tesla might have a cost of capital of 20% and a growth rate of 17.2%. Or it might have a cost of capital of 13% and a growth rate of 10.2%.

The ratio doesn't tell us exactly, but one thing it does tell us is that the market believes that Tesla's future growth rate will be very close to its cost of capital (unsurprisingly, Tesla's first quarter sales were 69% higher than this time last year).

If we repeat this with GM, we might imagine a cost of capital of 20% and a growth rate of only 3.3% - much less optimistic than Tesla.

In finance, growth is powerful. It explains why, despite being a much, much smaller company, Tesla carries a very high enterprise value. The market has taken notice that, though Tesla is much smaller than Ford or GM in total enterprise value and revenues today, that may not always be the case.


Brian.png

About the Author

Brian is a member of the HBX Course Delivery Team and is currently working on the new Leading with Finance course for the HBX platform. He is a veteran of the United States submarine force and has a background in the insurance industry. He holds an MBA from McGill University in Montreal.

Topics: HBX Insights, HBX Finance

Is Tesla Really Bigger than Ford or GM? Understanding Market Capitalization

Posted by Brian Misamore on April 18, 2017 at 5:16 PM

Tesla Blog Image.png

Since earlier this month, when Tesla's market capitalization passed both Ford Motor Company and General Motors, news organizations have been trying to figure out what to make of the market's consensus. Is Tesla, a young, electric-car manufacturer, really worth more than these behemoth, hundred-year-old automotive powerhouses? How can a company like Tesla with a reported $7 billion in revenue for 2016 possibly be worth more than GM, with $166 billion in revenue?

There are a few things to unpack here, from what market capitalization actually means, to differing capital structures, and reliance on equity.

Market Capitalization

Market capitalization is one of the simplest measures of a publicly traded company's value, calculated by multiplying the total number of shares by the present share price.

Market Capitalization = Share Price x Total Number of Shares

One of the shortcomings of market capitalization is that it only accounts for the value of the equity of the company, while most companies are actually financed by a combination of debt and equity. 

In this case, debt represents investments by banks or bond investors in the future of the company; these liabilities are paid back with interest over time. Equity represents shareholders who own stock in the company, and hold a claim to the future profits of the company. 

So instead of analyzing the companies' market capitalization, let's a look at their enterprise values, a more accurate measure of company value which takes into account these differing capital structures.

Enterprise Values

To find the enterprise value, we’ll combine each company's debt and equity, and remove the amount of cash the company is currently holding in their bank accounts, since that’s not part of their actual operations.  

Enterprise Value = Debt + Equity - Cash

Tesla currently has a market capitalization of $50.5 billion. On top of that, their balance sheet showed liabilities of $17.5 billion (this isn't the market value of their debt, which would be ideal, but it's close enough for this comparison). The company also has around $3.5 billion in cash in their accounts, giving Tesla an enterprise value of approximately $64.5 billion.

We can repeat this exercise for Ford and GM. Ford has a market capitalization of $44.8 billion, outstanding liabilities (again, from their accounting balance sheet) of $208.7 billion, and a cash balance of $15.9 billion, leaving an enterprise value of approximately $237.6 billion. GM has a market capitalization of $51 billion, balance sheet liabilities of $177.8 billion, and a cash balance of $13 billion, leaving an enterprise value of approximately $215.8 billion. 

Hopefully this understanding of enterprise value will provide some context to better understand the sensational headlines you’ve seen in recent weeks. In short, while Tesla's market capitalization is higher than both Ford and GM, Tesla is also financed more from equity. In fact, 74% of their assets have been financed with equity while Ford and GM have capital structures that rely much more on debt (17.6% of Ford's assets are financed with equity, and 22.3% of GM's).

When looking at the enterprise value of each company, it's clear that Ford and GM are still far larger companies than Tesla.

Why stop here? In our next post, we'll look at a key valuation ratio for the three companies to better explain why Tesla's market capitalization might be so high, even though the company is so much smaller than its rivals.


Brian.png

About the Author

Brian is a member of the HBX Course Delivery Team and is currently working on the new Leading with Finance course for the HBX platform. He is a veteran of the United States submarine force and has a background in the insurance industry. He holds an MBA from McGill University in Montreal.


Topics: HBX Finance

Is Holiday Cheer Driving the Market? Not Necessarily

Posted by Brian Misamore on December 8, 2016 at 9:21 AM

boxes.png

Because financial valuation is always forward-looking, today's market prices should incorporate all information about a company's performance - including expectations of future performance. As a result, anyone looking to make money on an individual stock (or write a compelling blog post) needs to look for surprises - times when reality over- or underperformed expectations.

So far, this holiday season seems to be off to a roaring start. Online sales on Cyber Monday hit a record $3.45 billion this year, and online sales on Black Friday topped $3 billion for the first time. UPS CEO David Abney reported to Bloomberg on November 28 that he expected 14% higher shipping volume this year than last year.

So, when researching this holiday blog post, I found several articles speaking glowingly about the stocks of UPS and FedEx, driven by this huge demand. So far, in 2016, UPS is up 20% and FedEx is up 30%, they said, boldly.

It makes sense, and it makes a compelling story. But is is true? The market is supposed to incorporate all information - was the market really surprised that this holiday season was good?

Actually, it turns out, the market has been relatively unimpressed by online sales this season. For example, Amazon's stock fell 3.79% between Black Friday and the end of the month of November, while the overall market (as represented by the S&P 500 index) only fell 0.27%. That suggests online sales under-performed expectations.

How about UPS and FedEx? Well, UPS went up 0.21% between Black Friday and November 30, and FedEx is up 0.87% in the same timeframe. Most of this growth begins Tuesday, November 29 - so clearly, Cyber Monday sales made a difference, but these numbers aren't exactly the 20% and 30% those articles were referencing.

Turns out, UPS is up this year mostly because they raised their dividend in May, turned in reliably growing performance all year, and then announced the acquisition of Marken on November 7, a life sciences supply chain company that will open up new business opportunities for them. FedEx's story is much the same - it beat market expectations with its quarterly earnings in March and September, seeing large price jumps at those times. Compared to the effects these events had on stock prices, both companies' end-of-November performance barely registers.

No one wants to write a story about how stock performance largely comes down to solid operations and good business models - it's so much flashier and exciting to talk about holiday sales and shopping events. But the market has thousands and thousands of analysts and investors trying to guess what those sales will be - its unlikely their consensus will be too far away from the truth.

Because the market is always trying to value the infinite future, long-term operational performance will always cause larger price movements than one-time events, and even surprises can leave investors unimpressed if they don't also change opinions about the company's future as a whole.


Interested in gaining a toolkit for making smart financial decisions and the confidence to clearly communicate those decisions to key internal and external stakeholders?

Learn more about Leading with Finance


Brian.png

About the Author

Brian is a member of the HBX Course Delivery Team and is currently working on the new Leading with Finance course for the HBX platform. He is a veteran of the United States submarine force and has a background in the insurance industry. He holds an MBA from McGill University in Montreal.

Topics: HBX Insights, HBX Finance

Trying to Understand the Post-Election Rally? Look Back in Time

Posted by Brian Misamore on November 29, 2016 at 10:15 AM

Stock-market.png

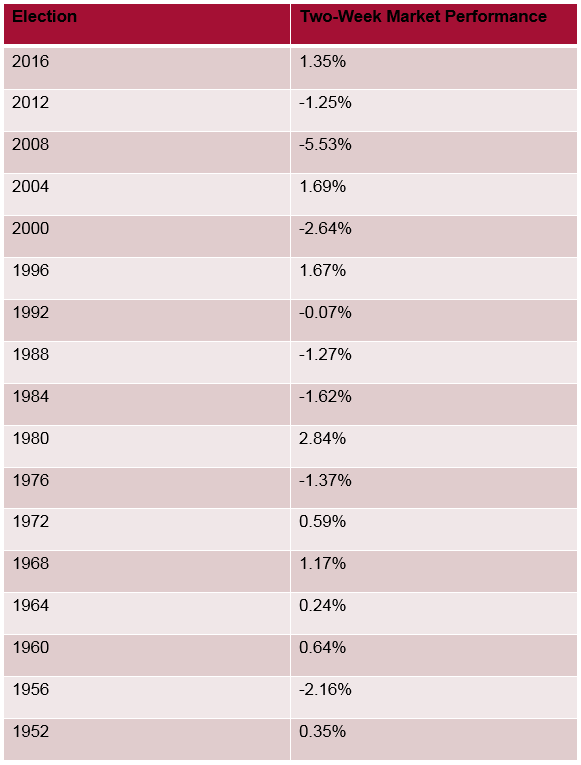
In the two-week period following the 2016 election, the stock market rallied by 1.35%. Is this normal following a presidential election? We dug into the data to find out.

To do this, we tracked the closing value of the S&P 500 stock index on election day, then the closing value two weeks later, for a period from 1952 to 2016 (for 1952 to 1980, we used the last day the market was open before election day). Here are our results:

table.png

During the period, the average two-week performance of the market after the election of a Republican was 0.29%, and the average two-week performance of the market after the election of a Democrat was -0.81%.

What does this tell us? Well, for most elections, other than entertainment value, surprisingly little. The value of the stock market at any given time is a forward-looking measure, meaning that investors attempt to take into account all available information when making pricing decisions. That means that the likely outcome of an election has already been “priced in” to the market price. This is especially true in elections that aren’t especially close – a good example is 2008, for which the change in the S&P 500 is more likely related to prevailing market conditions (the worsening financial crisis) than any repricing of stocks based on a “surprise” election outcome.

The election of 2016, however, was a surprise outcome, and so we should expect that most of the price shift might be related to the reaction to the result. In this case, the market feels that Donald Trump’s policies will likely favor American businesses, leading to an increase in the value of those businesses by approximately 1.35%. This change in expectation is not uniform, however. Banks have done exceptionally well (Bank of America is up 7%; Goldman Sachs is up 6%; Citigroup is up 5%), which is likely a result of Republican promises to repeal the Dodd-Frank financial regulation; whereas gun-makers have fared much more poorly (Smith and Wesson is down 7%; Sturm, Ruger & Co is down 9%), as the market had expected consumers to “stock up” in the event of a Clinton election and is now pricing in lower future cash flows for these companies.

As in all things, stock prices are a constant game, with all participants trying to forecast future cash flows and determine what those cash flows are worth today. Incorporating new information – including events such as elections – is critical.

Interested in gaining a toolkit for making smart financial decisions and the confidence to clearly communicate those decisions to key internal and external stakeholders?

Learn more about Leading with Finance


Brian.png

About the Author

Brian is a member of the HBX Course Delivery Team and is currently working on the new Leading with Finance course for the HBX platform. He is a veteran of the United States submarine force and has a background in the insurance industry. He holds an MBA from McGill University in Montreal.

Topics: HBX Insights, HBX Finance

6 Ways Understanding Finance Can Help You Excel Professionally

Posted by Brian Misamore on August 9, 2016 at 2:19 PM

personal_finance.png

For many people in the workplace, finance is a department shrouded in mystery. But finance affects each and every person in a company – it explains how their actions impact the company’s success, creates guidelines for the future, and sets meaningful metrics to determine performance. But what if you could see inside the mysteries of finance? How can understanding finance benefit you?

1. Learn how to analyze performance for your department

Finance gives you the tools you need to determine how well your department is performing, both by itself and as part of the greater company. Are you doing well? Who should you be compared to? What measures should you use for performance? Many companies choose the wrong metric for performance, or use the same metric for every department, and miss the unique ways in which each department contributes to corporate profits. A company that measures performance strictly in increased revenue targets, for example, may entirely miss the costs of increasing those targets (even as they may grow higher than the increased revenue!).

2. Interact better with your company's finance department

Many people think of their company's finance department as gatekeepers – a group primarily designed to say “no” to promising ideas. With the language of finance and an understanding of the factors they are considering, your finance department can become your partners, improving ideas and generating value-creating opportunities.

3. Unlock the true sources of value creation

Where does value come from? How do you improve your company’s worth to investors and the public? Is the project you’re working on actually making the company better off than if it were not done at all? Finance gives you the knowledge and the skills to answer these questions and to ensure that every project you take on will directly and meaningfully impact your company’s success.

4. Understand that actions tell stories

Everything that you or your company does tells a story that will be interpreted by someone else. What story are you telling? Are you accidentally sending a signal to your investors that hard times are coming? Or are you intentionally ensuring that your actions line up with your words and paint an accurate picture of the future of your company? In a world where investors must make guesses about what goes on inside a company, everything is analyzed – are you sending the right messages?

5. Appreciate the impact of your job

Ultimately, every position impacts the bottom line of a company. But how? It’s easy to see the impact that the Sales department may have on increasing revenues, but what about the IT department? Or accounting? Every department makes a measureable impact to the success of the company, and understanding the impact of your own job, using the tools of finance, can be the best first step to reaching a higher level of performance.

6. Understand investing and capital markets

Everyone interacts with capital markets, whether they know it or not. Your retirement fund is likely invested in a pension plan. Your personal investment portfolio is managed through a broker or packaged in a mutual fund. Finance can help you understand what makes a good investment – the places that can give your savings a secure and prosperous place to grow and multiply. Equally as important, it can show you what people are looking for in terms of investments and how your actions at your company can help to give it to them.

Finance doesn’t have to be a mystery. It can instead be the secret to your – and your company’s – success.


Interested in gaining a toolkit for making smart financial decisions and the confidence to clearly communicate those decisions to key internal and external stakeholders?

Learn more about Leading with Finance


Brian.png

About the Author

Brian is a member of the HBX Course Delivery Team and is currently working on the new Leading with Finance course for the HBX platform. He is a veteran of the United States submarine force and has a background in the insurance industry. He holds an MBA from McGill University in Montreal.

Topics: HBX Insights, HBX Finance

Word of the Week: Cash Conversion Cycle

Posted by Brian Misamore on July 26, 2016 at 1:04 PM

t-shirts-2-to-1.png

Have you ever walked into a store and wondered how they paid to fill it with products to sell? The easy answer might be, "with the money they made from the things they sold last month," and that's partially true, but what about for brand new stores? There's probably millions of dollars of inventory on the floor of many large retailers and hundreds of thousands of dollars of inventory on the floor of many small businesses. This working capital must be paid for - but how?

Many companies will take on debt to finance their inventories. Suppliers, eager to get business, will often offer credit terms, and each company decides how and when to take advantage of these through maintaining an Accounts Payable balance. This gap between paying for the products and receiving the money for selling them is called the cash conversion cycle.


Cash Conversion Cycle: the amount of time that passes between when a company spends money to buy an item and when they receive the money for selling it.


To calculate the cash conversion cycle, take the average number of days it takes to sell inventory, plus the average number of days it takes to receive payment for that sold inventory, minus the average number of days before paying for received inventory. In terms of accounting ratios, this is: 

Cash Conversion Cycle = Days Inventory + Days Receivables – Days Payables

A typical company receives inventory, pays later for that inventory, sells the inventory, then receives payment for it.

The implications of the cash conversion cycle are powerful. To illustrate with an example, imagine a company that buys t-shirts for $10 and sells them for $15 – a very simple business. If they have a cash conversion cycle of seven days, this implies that for one week they have lost the $10 needed to purchase each t-shirt but have not yet received the $15 for selling them. Where do they get money to buy more t-shirts and maintain their inventory? 

Financing this time through debt can impose a considerable cost on the company, especially for companies with very long cash conversion cycles. The longer the cash conversion cycle, the higher the interest paid on the debt.

Imagine a company that has a negative cash conversion cycle, like Amazon. By selling inventory quickly (low Days Inventory), receiving payment immediately for most sales (low Days Receivables) and putting off payment to suppliers for as long as possible (high Days Payables), their Cash Conversion Cycle is negative.

That means that Amazon actually gets paid for items they sell before they pay for them themselves. So, instead of paying interest to buy items for sale, they are receiving interest by holding cash in their bank account (or investing it in growing their company). This produces a powerful engine for cash generation and growth.

To learn more about the cash conversion cycles of Amazon and other organizations, take a look at this article from Forbes.


Interested in learning more about accounting as well as analytics and economics?

Learn more about HBX CORe


Brian.png

About the Author

Brian is a member of the HBX Course Delivery Team and is currently working to design a Finance course for the HBX platform. He is a veteran of the United States submarine force and has a background in the insurance industry. He holds an MBA from McGill University in Montreal.

Topics: HBX CORe, HBX Insights

Brexit and the Value of the British Pound

Posted by Brian Misamore on June 24, 2016 at 5:39 PM

Value of the British Pound

During Thursday’s Brexit vote, the value of the British pound fluctuated wildly – starting at $1.47/£, it climbed as high as $1.50/£ before dropping to $1.35/£. What causes these currency fluctuations? 

While the easy answer is “uncertainty” – and there is certainly a lot of uncertainty in Britain right now – the harder question might be “if I were running a business and needed to know what the value of the pound should be, what should I do?” Financial investors do this every day, and thousands were doing so Thursday night – and their actions caused the shifts in value.

Before the vote, it was speculated that the appropriate value of the pound if the "Remain" campaign were to win would be $1.55/£, and the appropriate value of the pound if the "Leave" campaign were to win would be $1.30/£. By the end of the vote – one of these would be true, but until then, how should they value the pound?

The best way to do this is to consider each scenario in a weighted average of their probabilities. This will yield what in finance is known as an “expected value.” In this case, if we believe the probability of "Leave" to be p%, then the expected value of the pound will be $1.30 * p% + $1.55 * (1-p%). 

Across the world Thursday night, analysts who wanted to know the value of the pound furiously tried to determine what p% would be, and from that, determine what they should do. Let’s say you were such an analyst, and you believed the possibility of a "Leave" victory was 25%. What should you do? 

Well, first, you would figure out what you believed the value of the pound should be, so: $1.30(.25) + $1.55(1-.25) = $1.48.

If the current value of the pound is $1.47/£, then you believe that it is undervalued. You should buy pounds, because they are currently cheap. If everyone believes that the probability of a "Leave" victory were 25%, then everyone will do the same, and eventually, the increased demand for the pound will increase the price – to exactly $1.48/£.

You can also take the current price and back out the assumed probability. As the exit polls came out, and a "Remain" victory looked likely, the value of the pound spiked to $1.50/£. What did that mean about p%?

Consider: $1.30(p%) + $1.55(1-p%) = $1.50. The value of p% is 20%. That means, at that point, investors believed there was a 20% chance of a Leave victory (meaning an 80% chance of a "Remain" victory). Overnight, as voting was counted, the value of the pound dropped to $1.35. $1.30(p%) + $1.55(1-p%) = $1.35. That means p% is 80%. The expected probability had flipped, with "Leave" now having an 80% chance of victory.

Thursday night, financial analysts were constantly revising their figures in an attempt to get ahead of their peers. The questions they were asking – what is the value of the pound if "Leave" wins? What is the value of the pound if "Remain" wins? And what is the probability of a "Leave" victory? – were translated into decisions to buy or sell the pound, which corresponded immediately into changes in its value.

These simple equations, along with your own intuition, can be the edge in preparing for uncertainty and knowing the expected future.


Want to know more about finance? HBX CORe will teach you the basics of Business Analytics, Economics, and Financial Accounting using Harvard Business School's renowned case-based methodology!

Learn more about HBX CORe


Brian.png

About the Author

Brian is a member of the HBX Course Delivery Team and is currently working to design a Finance course for the HBX platform.  He is a veteran of the United States submarine force and has a background in the insurance industry. He holds an MBA from McGill University in Montreal.


Topics: HBX CORe, HBX Insights

Understanding the LinkedIn Sale and Stock-Based Compensation

Posted by Brian Misamore on June 16, 2016 at 11:38 AM

stock-exchange-2-to-1.png

As you've likely heard by now, Microsoft purchased LinkedIn. So why did LinkedIn's leadership decide to sell the company? Many have started to speculate that Linkedin's reliance on stock-based compensation could be a contributing factor. 

So what exactly is stock-based compensation and why has it become so pervasive in corporate settings? 

One reason that companies started offering stock-based compensation was to correct what is called the “principle/agent problem.” Simply stated, the employees of a company (the “agents”) may not have the same incentives that the owners of a company (the “principles”) may have. If someone is both the owner and the manager of a business, they tend to be very careful with expenses – they economize by flying coach instead of 1st class, for example, or they maintain a simple office instead of an expensively furnished one. 

When the manager of a company is not also the owner, they have an incentive to make decisions that benefit themselves at the expense of the owners – they fly first class or maintain expensive offices. Giving employees stock-based compensation is an attempt to make them also part-owners of the company, and align their interests with the other owners.

Another reason, especially for small tech-based startups, is to avoid paying out cash. For many small companies, cash may be exceptionally tight, and paying employees in the form of stock offers payment tomorrow for work today. This can cut expenses for the company in the short-term and can be exceptionally profitable for the employee in the long-term – think about stories of the Google janitor now being worth millions, for example. Obviously, if the company does poorly, this isn’t the case.

So why all the concern? Well, when stock-based compensation is offered, it dilutes the existing shares of stock and reduces their value. If we imagine that the equity of a company is worth a set amount and doesn’t change depending on how many shares are outstanding, then issuing new shares must reduce the value of the existing shares – by exactly the amount given out in new shares. 

In this way, stock-based compensation should hurt Net Income by exactly the same amount as its listed value, just like an expense. But since it’s non-cash, many companies “adjust” their EBITDA to not include it. However, as this dilution effect can be very large, pressure has come from investors for companies to include this as an expense when reporting earnings.

As you can see in this New York Times article, many companies, including Facebook and Microsoft, have started doing exactly that.


Interested in learning more about Accounting, Economics, and Business Analytics?

Learn more about HBX CORe


Brian

About the Author

Brian is a member of the HBX Course Delivery Team and is currently working to design a Finance course for the HBX platform.  He is a veteran of the United States submarine force and has a background in the insurance industry. He holds an MBA from McGill University in Montreal.

Topics: HBX CORe, HBX Insights