<iframe src="https://5923915.fls.doubleclick.net/activityi;src=5923915;type=hbx_core;cat=hbx_b0;dc_lat=;dc_rdid=;tag_for_child_directed_treatment=;ord=1;num=1?" width="1" height="1" frameborder="0" style="display:none">
HBX Business Blog

How to Minimize Biases in Your Analyses

Posted by Jenny Gutbezahl on June 13, 2017 at 1:58 PM

illustration of three people completing a survey

In statistics, we draw a sample from a population and use the things we observe about the sample to make generalizations about the entire population. For example, we might present a subset of visitors to a website with different versions of a page to get an estimate of how ALL visitors to the site would react to them. Because there is always random variability (error), we don't expect the sample to be a perfect representation of the population. However, if it's a reasonably large, well-selected sample, we can expect that the statistics we calculate from it are fair estimates of the population parameters.

Bias is anything that leads to a systematic difference between the true parameters of a population and the statistics used to estimate those parameters. Here are a few of the most common types of bias and what can be done to minimize their effects.

Bias in Sampling

In an unbiased random sample, every case in the population should have an equal likelihood of being part of the sample. However, most data selection methods are not truly random.

Take exit polling. In exit polling, volunteers stop people as they are leaving the voting place and ask them who they voted for. This method leads to the exclusion of those who vote by absentee ballot. Furthermore, research suggests the people are more likely to gather data from people similar to themselves.

Polling volunteers are more likely to be young, college educated, and white compared with the general population. It's understandable that a white college student will be more likely to approach someone who looks like they could be one of their classmates than a middle-aged woman, struggling to keep three children under control by speaking to them in a language the student does not understand. This means not every person has the same chance of being selected for an exit poll.

Bias in Assignment

In a well-designed experiment, where two or more groups are treated differently and then compared, it is important that there are not pre-existing differences between the groups. Every case in the sample should have an equal likelihood of being assigned to each experimental condition.

Let's say the makers of an online business course think that the more times they can get a visitor to come to their website, the more likely they are to enroll. And in fact, people who visit the site five times are more likely to enroll than people who visit three times, who are – in turn – more likely to enroll than people who visit only once.

The marketers at the online school might mistakenly conclude that more visits lead to more enrollment. However there is are systematic differences between the groups that precede the visits to the site. The same factors that motivate a potential student to visit the site five times rather than once may also make them more likely to enroll in the course. 

Omitted Variables

Often links between related variables are overlooked, or links between unrelated variables are seen, because of other variables that have an impact but haven't been included in the model.

For example, in 1980, Robert Matthews discovered an extremely high correlation between the number of storks in various European countries and the human birthrates in those countries. Using Holland as an example, where only four pairs of storks were living in 1980, the birth rate was less than 200,000 per year, while Turkey, with a shocking 25,000 pairs of storks had a birth rate of 1.5 million per year.

In fact, the correlation between the two variables was an extremely significant 0.62! This isn't because storks bring babies, but rather that large countries have more people living in them, and hence higher birth rates—and also more storks living in them.

Rerunning the analysis including area as an independent variable solves this mystery. Many other (more amusing) spurious correlations can be found at tylervigen.com. While it may not be possible to identify all omitted variables, a good research model will explore all variables that might impact the dependent variable.

Self-serving Bias

There are a number of ways that surveys can lead to biased data. One particularly insidious challenge with survey design is self-report bias. People tend to report salary and education as higher than reality, and weight and age as lower.

For example, a study might find a strong correlation between a good driver and being good at math. However, if the data were collected via a self-report tool, such as a survey, this could be a side effect of self-serving bias. People who are trying to present themselves in the best possible light might overstate both their driving ability and their math aptitude.

Experimenter Expectations

If researchers have pre-existing ideas about the results of a study, they can actually have an impact on the data, even if they're trying to remain objective. For example, interviewers or focus group facilitators can subtly influence participants through unconscious verbal or non-verbal indicators.

Experimenter effects have even been observed with non-human participants. In 1907, a horse named Clever Hans was famous for successfully completing complex mathematical operations and tapping out the answer with his hoof. It was later discovered that he was responding to involuntary body language of the person posing the problems. To avoid experimenter expectancy, studies that require human intervention to gather data often use blind data collectors, who don't know what is being tested.

In reality, virtually all analyses have some degree of bias. However, attention to data collection and analysis can minimize it. And this leads to better models.


Interested in expanding your business vocabulary and learning the skills Harvard Business School's top faculty deemed most important for any professional, regardless of industry or job title?

Learn more about HBX CORe


About the Author

Jenny G

Jenny is a member of the HBX Course Delivery Team and currently works on the Business Analytics course for the Credential of Readiness (CORe) program, and supports the development of a new course in Management for the HBX platform. 

Jenny holds a BFA in theater from New York University and a PhD in Social Psychology from University of Massachusetts at Amherst. She is active in the greater Boston arts and theater community, and she enjoys solving and creating diabolically difficult word puzzles.

Topics: Business Fundamentals, HBX CORe

HBX CORe is like Crossfit for Your Brain

Posted by Erin Sorensen on June 6, 2017 at 4:46 PM

CrossFit For Your Brain.png

This post first appeared on LinkedIn Pulse.

I'll be the first to admit it, for the last 22 days I've been nervous. On Friday, April 21, 2017, I entered a freezing testing center at 2pm. In precisely three hours, I answered 135 questions on Business Analytics, Economics, and Financial Accounting. Today I learned I passed the exam.

Insert sigh of relief.

Why I Joined HBX CORe

Like many folks in the Boise cohort, I first heard about the Harvard Business School HBX CORe immersion program at Boise State University on NPR. In December, I discovered I could earn nine college credits while learning skills needed for a burgeoning startup. Don't get me wrong though, I knew about business operations before joining HBX.

My business education prior to HBX came from hands-on experience, running a community preschool, dabbling in real estate development, non-profit board governance, and managing rental properties. I've always been impressed with the expertise a well-versed MBA graduate brings to the table. But I didn't want to dive into an MBA program following two grueling years of engineering school. That would just be YUCK!

My plan is to work, build, solve problems and eat well. Not get an MBA.

HBX covers the fundamentals of an MBA in just 16 weeks (or less!). In fact, many learners use HBX as a litmus test to see if they have what it takes to pursue an MBA. I personally would hire someone on the spot if they passed HBX. I joined HBX so I could avoid common business mistakes and learn accrual accounting.

What was it like?

First, HBX was not easy. But don't just take my word for it. If you want to join HBX do your homework first. There are several years of HBX graduates all over the globe. Google them. Connect.

HBX CORe is a significant time commitment. For me, HBX occupied 15 to 20 hours each week. You will fail if you think you can swoop in after a long day at work or school and take a couple of quizzes and pass in-between dinner with the kids and a little R&R time. There are faculty and protagonist videos, practice questions, interactive learning tools and peer-to-peer learning and engagement. 

I was particularly shocked by my first "cold call", as I I had to answer a tricky, and rather long question, in one minute. The cold call lasts one minute, including response time, and, at the end of the minute, your response is automatically submitted. Then your classmates review and comment on your quick witted thinking. Just like real life...or Twitter.

My cohort was comprised of roughly 300 participants from around the globe. The diversity of the group was tremendous, ranging from fortune 500 executives to college freshman. Through the HBX platform and social media, we were miraculously fortified, across national borders, as one body of learners. I also got to connect with my equally brilliant "local cohort",  as others in Boise were enrolled in the same program .We were all working to exhaustion but we were in it together—and together is an awesome movement.

I thrive on stress and deadlines. HBX did not disappoint. Some weeks overlapping assignments were due. The project manager in me loved this aspect. It proved to be an exhilarating challenge to meet demanding deadlines.

Five reasons why HBX is CrossFit for the brain:

My arms were getting squishy and my husband suggested I join CrossFit with him. So I did. I've been working on my outside and inside self, I thought I'd share similarities:

1. CrossFit is constantly varied functional movements performed at high intensity. HBX is intense work, questions from quizzes are not like the test, you learn to solve problems from the variation. With CrossFit, you develop a balanced physique. With HBX you develop a balanced understanding of business management.

2. CrossFit is made of the best workouts from gymnastics, weightlifting, running, rowing and more. HBX brings in world renowned subject matter experts who teach the most critical aspects of running a business.

3. CrossFit is data driven, individuals use their own statistics to improve physical performance over time. HBX uses data to show student's baseline scores so that they can improve with vigorous study.

4.  CrossFit is a sport that becomes magnetic when a community comes together to do workouts. I can't imagine HBX without learners connected to each other via the platform. The camaraderie that developed with the crew on Facebook was simply organic after initial connections were made. Without multiple touchpoints to other learners, HBX would just be another (boring) online course. Even my CrossFit group has a Facebook page, it's good for the FOMO's.

5. CrossFit was developed for universal scalability making it an ideal workout for any committed individual. You will get out of HBX what you put into it, my brain feels gigantic, but I still know I have a lot of learning ahead to mastery. Fortunately, I'm able to further my studies on my own time, building on the great platform HBX has helped me form.

Fun CrossFit Fact: RUTH BADER GINSBURG CAN BENCH PRESS 70 LBS AT AGE 84!

Huge hearty thanks to HBX for giving my brain a workout and connecting me to a community of internationally acclaimed thinkers and doers. I'll forever be grateful for this experience.


Interested in learning more about Business Analytics, Economics, and Financial Accounting? 

Learn more about HBX CORe


About the Author

Erin Sorensen

Erin Sorensen is an entrepreneur, student, mom and community advocate. When she’s not dreaming and doing, she is working on an Engineering degree at Boise State, volunteering in her neighborhood or enjoying the outdoors with her family. In 2016, Erin received a Dorothy Richardson Resident Leadership Award from NeighborWorks America, which is bestowed annually to eight citizens across the nation in recognition of outstanding community leadership.

Topics: HBX CORe

How to Minimize the Margin of Error in an A/B Test

Posted by Jenny Gutbezahl on May 23, 2017 at 4:07 PM

A-B Test showing different content on two computer screens

Often when you encounter statistics in the newspaper, in a report from your marketing team, or on social media, the statistics will include a "margin of error." For example, a political poll might estimate that one candidate will get 58% of the vote "plus or minus 2.8%." That margin of error is one of the most important – and least attended to – aspects of statistics.

In statistics, error is any variability that can't be explained by a model. In mathematical symbols, we would say Y = f(X) + error. In words, we'd say, the dependent variable (what we're interested in predicting) is some function of other variables we're measuring, plus error. 

The reason this is called "error" is that when we create a statistical model, we use it to predict our dependent variable. For example, Amazon might run an A/B test where they randomly show a subset of their customers one version of a product page and the remaining customers a different version. They are trying to see if specific aspects of the page affect how much people spend on the product. In this case, Y is the amount spent, and X is the version of the page that they see. 

Perhaps, people who see the first page spend an average of $28, and people who see the second page spend an average of $35. If we know that someone saw the first page, and we know nothing else about him or her, our best guess would be that they spent $28. Any difference between what is actually spent and $28 is error (similarly, for people who see the second page, the difference between actual spending and $35 is error). 

We always expect some variability across the people in our sample, so we’d expect there to be SOME difference between the people who see the first page and the people who see the second, just by chance. If the errors are distributed in a predictable manner (usually in a bell-shaped curve, or normal distribution), we can estimate how much difference there should be between the two groups, if the page had no effect. If the difference greater than that estimate, we assume that difference is due to which page they saw.

Here are some of the things that contribute to error:

Variables missing from our model

There are a large number of variables that could influence spending, including: Time of year, the economic climate, individual information such as income, and computer-related issues, such as how they found the site and how fast the connection is. If these variables can be easily collected and added to the model, the model would still be Y=f(X) + error, but X would include not only the product page, but all the other information we have, which would likely lead to a better prediction. 

Actual mistakes

Maybe the person wants to buy two items, but accidentally hits 22. Oops! Or maybe the analytics engine was configured incorrectly or the dataset got corrupted somewhere along the way through human error or a technical problem.  You can minimize the effect of mistakes by taking time to review and clean your data

Misleading or false information

Maybe the person coming to the site is from a competing retailer, and has no intention of buying the product – they are just visiting the site to do research on the competition. While this source of error is relatively uncommon in behavioral data (such as purchasing a product), it is very common in self-report data. 

Respondents often lie about their behavior, their political beliefs, their age, their education, etc. You may be able to correct for this somewhat by looking for strange or anomalous cases and doing the same sort of cleaning you'd do for mistakes. You could also use a self-report scale that estimates various types of misleading information, such as this one.

Random or quasi-random factors

There are a number of factors that can lead to variability that are more or less random. Maybe the person is in a good mood, and so more likely to spend money. Maybe the model on one of the product pages looks like the shopper's 3rd grade teacher, who they hated, so they navigate away from the page quickly.

Maybe the person's operating system happens to update just as they are getting to the page, and by the time they reboot, they move on to other things. These things probably can't be built into the predictive model, and are difficult to control for, so they will almost always be part of the error.

Bias

So long as errors are basically randomly distributed, we can make a good estimate of how much money visitors will spend and how much this varies between versions. If we have a lot of random error, we may not be able to make a very accurate prediction (our margin of error will be large) but there's no reason it should be wrong one way or the other. 

However, systematic error leads to biased data, which will generally give us poor results. For example, if we decide to run one version of the product page for a month, and the other version the next month, the data may be biased based on time. If the first month is December and the second is January, or if there is a major change to the stock market toward the end of the first month, our comparison won't be valid. That's because the people who see the two pages differ systematically. 

Therefore, differences in spending between the pages are not due to random chance; some of that difference is due to bias. This makes it impossible to determine how much is due to the differences between the pages. The best way to address this is through good study design. Every single person who comes to the site should be equally likely to go to each page. 

It's never possible to completely eliminate error, but well-designed research keeps error as small as possible, and provides a good understanding of error, so we know how confident we can be of the results.


Interested in learning more about Business Analytics, Economics, and Financial Accounting? Our fundamentals of business program, HBX CORe, may be a good fit for you:

Learn more about HBX CORe


About the Author

Jenny G

Jenny is a member of the HBX Course Delivery Team and currently works on the Business Analytics course for the Credential of Readiness (CORe) program, and supports the development of a new course in Management for the HBX platform. Jenny holds a BFA in theater from New York University and a PhD in Social Psychology from University of Massachusetts at Amherst. She is active in the greater Boston arts and theater community, and she enjoys solving and creating diabolically difficult word puzzles.

Topics: Business Fundamentals, HBX CORe

A New Graduate's Guide to Navigating Opportunity Costs

Posted by Patrick Healy on May 16, 2017 at 3:52 PM

Harvard Graduates celebrate on Commencement Day

It’s that time of year again: college graduation! When professors wear ridiculous robes, the band plays Pomp and Circumstance, and weepy parents watch their babies don caps and gowns and walk across the stage to get their hard-earned diplomas.

It’s a magical time, full of hopes, dreams, and, for many graduates, intense anxiety about what’s next.

After diplomas are handed out and the band plays its final tune, it’s time for newly minted graduates to head out into the real world. If you’re in this boat, this may be your first time living on your own, managing your finances, and doing your own grocery shopping. It’s an exciting (and scary) new chapter of life, full of responsibilities and big decisions. And, if you’re like me back in 2013, you’ll probably have little idea what to do or how to make those decisions.

Never fear, economics is here to lend a hand! You're probably thinking, “Economics? You mean that class I never took in college?” Yep, that’s the one!

Most people think economics has to do with investing or the stock market (that’s finance actually). But in reality, economics is mostly concerned with how people make decisions and the ways their choices interact. To that end, the field of economics contains several principles, tools, and frameworks that you can use to think about the decisions you’ll make after school (and those you face every day).

Few concepts are more important than the principle of opportunity cost.

After graduation, you’ll undoubtedly face many decisions: where to live, what to do for work, who to date, and countless others. In each of these choices, you will face trade-offs. If you take a job at a consulting firm, for example, you’ll likely have to travel a lot and won’t be able to sleep in your own bed. If you date Lily or James, you (presumably) won’t be able to date Arthur or Molly. No choice is the “perfect” one because you must always give up something else in order to get it.

Economists like to say that “there’s no such thing as a free lunch.” The idea is that even if someone offers to buy you lunch, the meal isn’t costless. You still “pay” for it in the form of the time you spend at lunch not doing other things (like reading the new book you brought to work or dining with someone more interesting).

In fact, you incur costs with every decision you make. The opportunity cost of a decision is the value of the next best thing you give up to make that choice. In other words, it’s what you sacrifice in order choose one course of action over another. 

Post-graduate life (and life in general) is full of opportunity costs that you should account for when making decisions. For example, suppose you’re thinking about going to graduate school. If you do, you’ll need to pay tuition, buy books, and incur other expenses. The full price tag? $100,000 over two years. But the actual cost of attendance is much higher than this!

Why? Because, if you do attend, you forego the salary you could have earned by working. If you could get a job paying $50,000 per year, for instance, the total cost of grad school (accounting for this opportunity cost of not working for two years) has just doubled! 

But opportunity costs don’t just factor into career decisions. For example, suppose you’ve gotten a job in a new city and are now looking for a place to live. Your salary is modest, so you are hoping to rent as cheap a place as possible. You look in the city, but the apartments are so expensive! You eventually find a place for $300 per month less than ones right by work, but it is an hour train ride away. Should you take the apartment?

Well, it depends how much you value your time. If you do take it, that’s 2 hours in the car each day. 30 days per month, and that’s 60 hours total of time lost to driving (more with traffic). Is 60+ hours of your time worth $300 dollars to you?

Economics can’t tell you whether or not to exchange time for money. But it can provide important principles and frameworks with which to help you make these decisions.

So when you’re making big decisions as a newly minted graduate, remember to consider opportunity costs—there’s no such thing as a free lunch!

Although, if you do value your time, you can always get lunch delivered.


Interested in learning more about Economics, Financial Accounting, and Business Analytics? Our fundamentals of business program, HBX CORe, may be a good fit for you:

Learn more about HBX CORe


About the Author

pat-headshot.png

Pat is a member of the HBX Course Delivery Team and currently works on the Economics for Managers course for the Credential of Readiness (CORe) program. He is also currently working to design courses in Management and Negotiations for the HBX platform. Pat holds a B.A. in Economics and Government from Dartmouth College. In his free time he enjoys playing tennis and strumming the guitar.

Topics: HBX CORe, HBX Insights

Why Your STEM Career Requires Business Skills

Posted by Kyle Rosenmeyer on April 27, 2017 at 9:46 AM

STEM Blog_Sewer Pipes.pngFrom a very young age, I was interested in design. Toys that could be infinitely reconfigured like Legos and SimCity captured my imagination for hours. Interests at home influenced my interests at school, and by age 13, they had coalesced into the goal of becoming an engineer. This drive grew, and propelled me for over a decade, to graduation day at Boise State University. I had done it. I had become a Civil Engineer and had landed a job in STEM (Science, Technology, Engineering, and Math).

Discovering STEM

Looking back at my childhood, I can’t remember how old I was when I first heard the acronym STEM, although today it's a difficult word to miss in the education world. In a day and age where technology moves the world forward by leaps and bounds and cities are larger than ever in history, the demand for both STEM professionals and innovation is increasing exponentially. STEM programs and messaging have increased in schools to help meet this demand. However, spending time in the workforce uncovered another message for me that hadn’t been drilled in: understanding business is critical to success in STEM. 

Why an Engineering Degree is not Enough

I loved working as an engineer, but in order to prepare myself for future jobs, I needed business acumen. Senior engineers and division and department heads all use more business skills in day-to-day work than engineering skills. My STEM education gave me a way to solve problems and think logically, but I needed to understand accounting tools, financial reports, and markets to compete. I hadn’t studied business in school, so I started looking. Free workshops to six figure master’s programs, I found HBX CORe somewhere in the middle of the range, at 12 weeks and a fraction of the price of a master’s degree. For me, it was a great fit to learn business fundamentals as a busy professional.

The Impact of HBX CORe

I took CORe in 2016 and I have great things to report. I am more confident in my current role and tackling the jobs that I want. I was even able to turn my photography hobby into a side business. HBX CORe offered an amazing opportunity to learn from the experts at Harvard Business School, interact with students all over the world, and, in my case, reconnect with my local university.

CORe provided a new lens to understand the world that I didn’t experience while studying engineering. Regular tasks in work are now easier to navigate: requesting budgets, managing expenses on construction projects, using data to drive decision making, and communicating with coworkers in finance. Business fundamentals helped me contribute more to my organization, during meetings, and in general communications—it helped me do better work and stand out in my field. 

Business is important to any STEM career. The blend of skills between business and STEM educations are formidable in today’s market place. Companies need to think differently to solve today’s problems and this requires increased versatility and innovation at the employee level to move the organization to the next level. Even if you don’t want to be CEO or CFO, you will need a business skill set. You must work with money, budgets, and financial teams to be effective and impactful. However, regardless of your career, most paths ahead of you involve business. The higher you work up the org chart, the more business skills you'll need to lead people and teams, and effectively run organizations. 

If you’re working in STEM, I'm confident you want to change the world. Use my story as an example that knowing and understanding business significantly helps. Use business skills to compliment your education and stand out for the job you want. I’ve had great opportunities in my career to work in both private and public sectors—building the same sewers and roads that I simulated building 20 years earlier in a video game. And working for my hometown, the City of Boise, has proved to be an incredibly rewarding place to make an impact and the most satisfying time of my life. Thank you HBX for giving me a new tool to build and shape my life.


About the Author

Kyle Rosenmeyer is a practicing engineer in Boise, Idaho. He Headshot of Kylereceived his undergraduate degree in Civil Engineering from Boise State University and has spent over 10 years working on infrastructure in transportation and waste water collection systems. Kyle is an advocate for mentorship and community involvement, leading the professional development programs for the Boise Young Professionals Network and volunteering on a regular basis. 

Topics: HBX CORe, Student Bloggers

A Beginner's Guide to Understanding Your Taxes

Posted by Jackie Merriam on April 6, 2017 at 4:18 PM

A Beginner's Guide to Understanding Your Taxes - Frightened man clutching money runs away from a dog in a TAX sweater

If you live in the United States, it’s that time of year again! Have you filed your taxes yet? April 18 is the filing deadline for individual income tax returns (Procrastinators, rejoice! You have three extra days to file this year).

While the various tax forms, rules, and regulations can be confusing, the basic tax formula is actually pretty simple. If you break it down, your tax refund or the tax you have to pay is calculated like this:

Total Income - Deductions = Adjusted Gross IncomeAdjusted Gross Income - Exemptions - Standard or Itemized Deducions = Taxable IncomeTaxable Income x Tax Rate = TaxTax - Credits = Total Taxes OwedTotal Taxes Owed - Taxes Already Paid = Refund Amount


Seems easy enough, right? But what do each of those terms actually mean? 

Total Income vs. Adjusted Gross Income (AGI) vs. Taxable Income

There are many “income” amounts that appear on your tax forms.

Total Income simply represents all the money that you made in compensation during the year—whether that was from your employer, through investment interest, or other forms of compensation.

Adjusted Gross Income (AGI) is the amount of money that you made this year, less any specific deductions.

Taxable Income is the amount that you will use to calculate your tax.

Deductions vs. Credits

Deductions and credits are very similar, in that they both reduce your tax, but how and when they reduce your tax differs.

Deductions are amounts that you subtract from your income, and are taken out before you calculate the total tax owed.

Credits are amounts that are taken out after you have already calculated your tax, so they reduce your tax directly. Credits are generally more beneficial than deductions because they reduce your tax directly dollar-for-dollar, whereas deductions reduce your taxes indirectly by reducing your income.

To illustrate this, let’s take a simple example. Say that you made $100 this year, and your tax rate is 10%. Let’s say that you have an option to take a $15 deduction or a $15 credit. These two options can be illustrated with the formulas below:


  Deduction Option

  Credit Option 

Total Income      $100    $100 
–  Deductions       -   $15        -   $0  


AGI      $85      $100 
         
Tax (AGI x 10%)      $8.50     $10 
–  Credits    $0   $15 


Total Tax      $8.50     $5 refund

In this example, if you take the credit you actually don’t owe any tax, but if you take the deduction you would owe $8.50 of tax. This simple illustration shows that credits are (almost always) more beneficial than deductions.

Why do credits and deductions exist? Well, it isn’t because the government wants to reduce your tax liability out of the goodness of their heart. They exist because the government is trying to incentivize certain behavior. For example, they want people to pursue higher education, so there are tuition deductions and credits and student loan interest is deductible.

Standard vs. Itemized Deduction

While all other deductions apply to people differently, every tax payer is entitled to either the Standard or Itemized Deduction.

The Standard Deduction is a set amount that every tax payer can subtract from their income. The amount varies depending on your filing status, but it is adjusted each year to account for inflation.

Taxpayers also have the option to itemize their deductions. Itemized Deductions are the total of specific amounts, including medical and dental expenses, amounts given to charity, amounts lost to theft, taxes and interest paid, and any job expenses that were not reimbursed by your employer.

If the total of all these amounts is greater than the standard deduction amount, you should itemize your deductions. If the total of these amounts is less than the standard deduction, you should take the standard deduction.

Part of the reason that the standard deduction exists is because, for most people, the things that are included on the itemized deduction list are often hard to track and value. For example, giving a box of clothing to your local charity is deductible, but the value of that clothing is often subjective and hard to determine. You also may give small amounts of money to charities here and there that would be hard to track over the year.

Under this system, taxpayers can still take a deduction, without having to worry about tracking every dollar. IRS data indicates that roughly 30% of Americans itemize their deductions, and high-income taxpayers are more likely to itemize.

Exemptions

Each taxpayer who is not claimed as a dependent can claim a personal exemption. Taxpayers can also claim an exemption for each person that they list as a dependent. The exemption is a standard amount that reduces your adjusted income.

To determine your exemption, simply count the number of dependents that you claim (including yourself and your spouse) and multiply it by the exemption amount. Exemptions reduce your income to account for the fact that you have to pay money to take care of yourself and attempt to align the tax amount with a household’s ability to pay tax. 

There are hundreds of pages of rules and regulations in the Internal Revenue Code, and it changes constantly, but these simple terms will help you to better understand your return.


About the Author

Jackie Blog Round.pngJackie is a member of the HBX Course Delivery Team and currently works on the Financial Accounting course for the Credential of Readiness (CORe) program. She also works on the Leading with Finance Course, and is working to design and develop a course in Entrepreneurship for the HBX Platform.

Jackie holds a BSB in Accounting in Finance, and a Masters of Accountancy, all from the University of Minnesota. In her free time she enjoys cheering on her favorite Minnesota sports teams and baking.

Topics: HBX CORe, Financial Accounting

Going Beyond the Stats: Cinderella Teams and the Anscombe Quartet

Posted by Jenny Gutbezahl on March 16, 2017 at 10:36 AM

basketball and a bracket

As we head into March, watercooler discussions naturally turn to the NCAA basketball championship and who's going to win the office bracket pool. The popular statistics site FiveThirtyEight has generated win likelihoods for all teams as they have in the past, but this year predictions are less certain than ever.

Even the top-ranked Villanova is given only a 15% chance of winning. As you may recall, last fall FiveThirtyEight garnered a lot of attention by being relatively uncertain about a Clinton win in the general election – this skepticism proved to be well-founded.

To make datasets more comprehensible, statistics summarize datasets with one or two numbers; this can obscure patterns. In college basketball, the entire complexity of a team's season performance can be reduced to the Rating Percentage Index (RPI), a ratio based on the team's wins and losses, and the strength of the teams played (based on those teams' wins and losses, and the wins and losses of the teams they played). Interested readers can find a fuller explanation, including the computational formula here.

Last year, Michigan State's impressive RPI of .6272 led to a No. 2 seed position. Middle Tennessee State on the other hand, with an RPI of .5562, was seeded at No. 15. And yet, on March 18, Middle Tennessee won 90-81 against Michigan State. Middle Tennessee turned out to be a Cinderella team; while it looked like they might end up as the belle of the ball, at the last moment, they choked and their carriage turned back into a pumpkin.

This year, Middle Tennessee is seeded as the underdog in the 12 spot, with a somewhat stronger RPI of .5960. Many pundits (though not FiveThirtyEight) are looking at them to do better than expected in the postseason, which would not be too unusual for a No. 12 Seed.

However, just looking at RPI (and last year's performance), may not provide enough information. While looking at all the specifics of a sports season, a national election, or a data distribution can be daunting, it is often necessary to do so if you want a full understanding of what's going on.

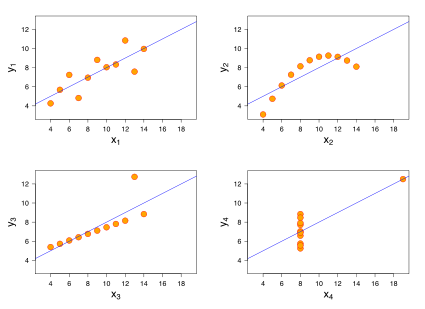
In 1973, the English statistician Francis Anscombe came up with an elegant way of demonstrating this. He created four data sets, each containing 11 data points with two values. In all sets the means and sample variances for the two variables are identical, as are the correlation between the two and the regression line predicting y from x:

anscombe table.png

You'd think these four distributions would be pretty similar, with only minor differences due to random variability. You might also think that linear regression would be an effective model to help make predictions based on the data, in all cases.

But you'd be wrong. These are the four data sets:

image showing Anscombe Quartet
Source: Wikipedia

The upper left graph shows a distribution which is about what we'd expect from the statistics, and the linear regression model is a good fit for this data set. The upper right graph clearly has a curvature. There's likely to be a great model for prediction, but it's NOT linear (the best model probably includes x2).

The two bottom models are more problematic. The one on the left shows a linear relationship – but that one outlier near the top is pulling the regression line away from the rest of the data. And the one on the bottom right is a real challenge. It looks as though, in general, x is a poor predictor for y. That is, almost all cases have an x-value of 8 and the y-values vary quite a bit, untethered to x. And one strange case, all by itself, is driving the entire model. 

A similar situation exists in sports. Looking at summary stats for the season might make for a good model, or might overlook a non-linear relationship, or might be slightly (or greatly) misleading, due to a few unusual games, players, or plays, which may not translate to the post-season. That's why creating a bracket is so much fun!


jenny

About the Author

Jenny is a member of the HBX Course Delivery Team and currently works on the Business Analytics course for the Credential of Readiness (CORe) program, and supports the development of a new course in Management for the HBX platform.

Jenny holds a BFA in theater from New York University and a PhD in Social Psychology from University of Massachusetts at Amherst. She is active in the greater Boston arts and theater community, and she enjoys solving and creating diabolically difficult word puzzles.

Topics: HBX CORe

5 Things You Didn't Learn in Undergrad Economics

Posted by HBX on January 17, 2017 at 2:55 PM

money-hand.png

Many prospective students ask us whether it is worthwhile to take HBX CORe if they have a background in business economics. With a number of economics majors on the HBX staff, we found this question especially interesting, so we've rounded up five things we teach in HBX CORe that weren't a part of our undergraduate education.

Willingness to Pay

In a typical undergrad microeconomics course you may learn a lot about utility, indifference curves, wealth, and substitution effects. But post college – and in CORe – it’s all about Willingness to Pay (WTP). This is the maximum amount someone is willing to pay for a good or service (e.g. my WTP for an UberPool is around $4), but collecting accurate data is easier said than done, as there is often a gap between people's hypothetical and actual WTP.

Market Demand

This brings us to our second point – did you ever learn how to properly measure demand? Two tools in every marketer’s pocket are polls and surveys, but understanding proper poll and survey design is essential to collecting accurate demand information. Most economics courses miss the boat on this one.

Conjoint Analysis

Surveys and polls are one thing, but if you want to dive deeper into demand for specific features you will need to know Conjoint Analysis—a statistical approach to measuring consumer demand for specific product features. This tool will allow you to get at the surprisingly complicated feature and price tradeoffs consumers make every day.

For example, pretend you are Apple Inc. and you want to know what part of the iPhone you should improve; battery life, screen size or camera. A conjoint analysis will let you know which improvement customers care about more and are worth the company’s time and money. 

Cognitive Biases

Undergrad economics makes a lot assumptions on how people behave. It’s often assumed that people are (1) aware of all the different options available to them and (2) that individuals are able to accurately rank the varying options based on their preferences. However, these assumptions often fail, sometimes in meaningful ways.

There are hundreds of examples of cognitive biases that affect our decision making processes. For example, you may rely too heavily on the first piece of information you receive, reducing the value of all subsequent information. Or maybe you only listen to information that confirms you original inclination.

Understanding these cognitive biases is crucial when trying to predict human behavior in the real world.

Strategy

Business strategy is a field in and of itself, but it is often glossed over by undergraduate programs. If you stick to purely undergrad economics, you may miss out on critical tools and frameworks to develop, maintain and assess different strategies, including Porter’s Five Forces, SWOT Analyses, and Core Competencies.

In short, what sets HBX CORe apart from many undergraduate Economics programs is it's focus on applicability and real-world situations. We don't just want students to be able to memorize concepts and formulas, we want them to be able to solve problems, inform strategies, and execute ideas that will help move their organizations forward.


Interested in learning Financial Accounting, Business Analytics, and Economics for Managers?

Learn more about HBX CORe

Topics: HBX CORe, HBX Insights

5 Highly Effective Visual Displays of Data

Posted by Jenny Gutbezahl on January 12, 2017 at 10:42 AM

data-networks.png

The past decade has seen the rise of digital databases along with the development of new tools to create engaging, often interactive, visual displays. Today, anyone with an interest in a topic can easily find relevant data and present it in an interesting way.

Here are a few examples that caught my fancy:

Jobs

npr
Source: NPR

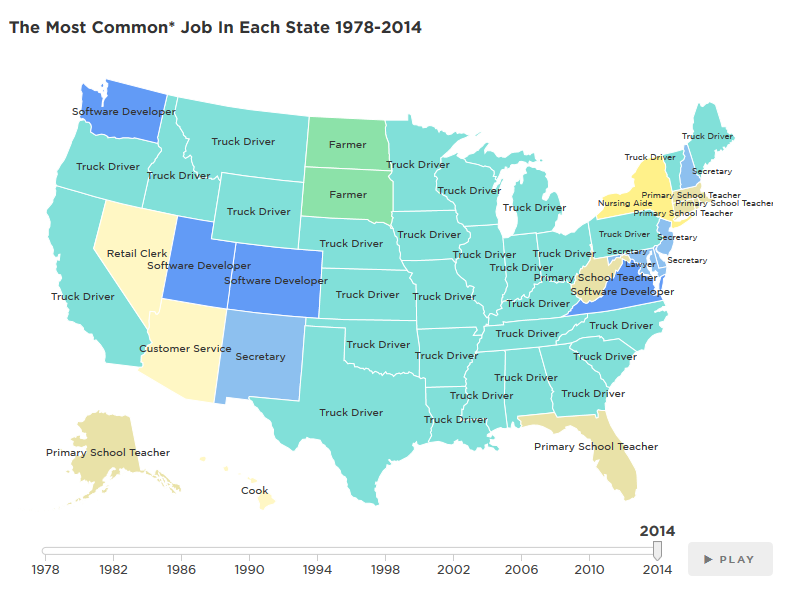
National Public Radio has produced a great animated display of the most common jobs in each state, year by year from 1978 to 2014.

My favorite part: The story is told by jobs that gain in popularity and then become less common.

Web-Related Statistics

internet live stats
Source: Internet Live Stats

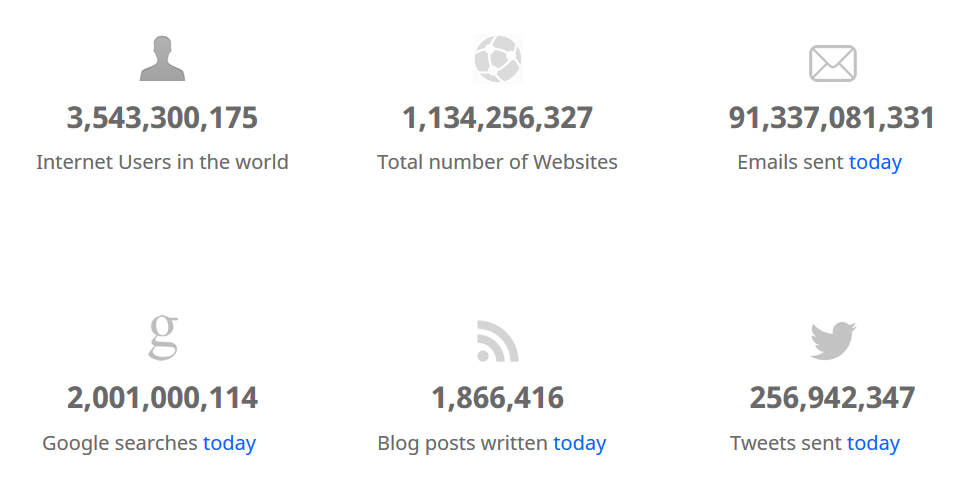
Internet Live Stats has tracked web-related statistics and pioneered methods for visualizing data for several years, and it's instructive to see how different digital properties have ebbed and flowed over time. 

My favorite part: The "One Second" tab, which shows the number tweets, Facebook posts, Instagram photos, and other digital content shared each second. The way they present this information is extremely effective.

Beer

beer
Source: FlowingData

If you love beer as much as I do, you'll appreciate Flowing Data's graphic analysis of beer attributes and how they relate to different styles. And if you just like cool visual displays of data, you'll probably spend a lot of time poking around the site (which I find even more addictive than TV Tropes). 

My favorite part: The examples of each type of beer, which make it easy to find new brews to try.

Food

food
Source: Eater

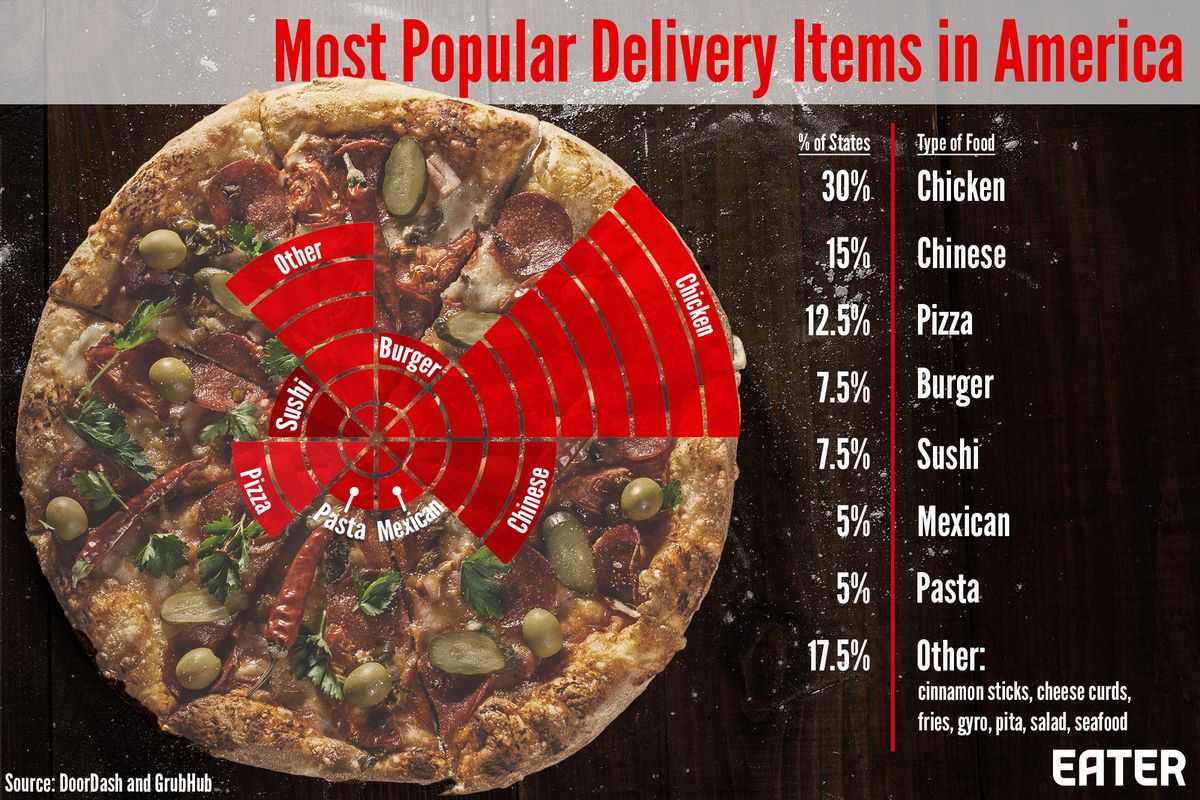
Eater is a great site for all kinds of interesting food information, and has created this interactive, which shows the most common foods ordered for delivery in each state of the US. Warning, this may make you hungry!

My favorite part: Learning that my fellow Massachusetts residents love sushi just as much as I do!

Hamilton

hamilton
Source: Wall Street Journal

And finally the Wall Street Journal gives us an interactive visual presentation on the rhyme structure of the lyrics of Hamilton, along with some qualitative analysis of its influences, ranging from Gilbert and Sullivan to Rakim.

My favorite part: The links to various works that inspired Lin-Miranda as he was writing the show.


Interested in learning more about how to interpret data? Take HBX CORe and discover the basics of Economics for Managers, Financial Accounting, and Business Analytics.

Learn more about HBX CORe


jenny

About the Author

Jenny is a member of the HBX Course Delivery Team and currently works on the Business Analytics course for the Credential of Readiness (CORe) program, and supports the development of a new course in Management for the HBX platform.

Jenny holds a BFA in theater from New York University and a PhD in Social Psychology from University of Massachusetts at Amherst. She is active in the greater Boston arts and theater community, and she enjoys solving and creating diabolically difficult word puzzles.


Topics: HBX CORe, HBX Insights

Word of the Week: A/B Testing

Posted by Anna Vallee on December 15, 2016 at 8:51 AM

AB-Testing.png

You’ve probably been in a meeting where a lot of ideas are circulated about how to improve an existing product or service. In these meetings, differing opinions can quickly turn into a battle of long-winded defenses. Fortunately, the emergence of A/B testing – once thought to be exclusive to tech firms – has become a viable and cost-effective way for all types of businesses to identify and test value-creating ideas.


A/B Testing: in statistical terms, A/B testing is a method of two-sample hypothesis testing. In laymen’s terms, this means comparing the outcomes of two different choices (A and B) by running a controlled mini-experiment.


Although the concept of A/B testing was galvanized by Silicon Valley giants, the rationale behind A/B testing is not new. The practice borrows from traditional randomized-control trials to create smaller, more scalable experiments.

As a very basic example, let’s say you are an abstract artist. Your paintings are informed by the world around you, but you cannot merely mimic landscapes. You are confident in your technique, but you still aren’t sure how the outside worldand more importantly art critics—are going to respond to your new paintings. Assessing the quality of art is a famously challenging process.

If you were to employ A/B testing for this scenario, you would start by creating two different paintings that are exactly alike. As you continue working, you would decide to change one small thinglet’s say you add a red square to one painting and not the other. Again, this means that everything about the paintings are alike except for this one modification. Once the change is made, you display the two paintings in randomly selected art galleries across the country and wait for your art agent, or another unbiased third party, to gather the reactions and report back to you.

After each painting has been placed in a reasonable amount of art galleries, perhaps you are informed that the painting with the small change received significantly more praise, or maybe it did not. The hypothetical outcome does not matter. Rather, what matters is that you can be reasonably confident that your change will or will not make the painting better, and you can go on to create better art as a result.

 USA’s Most Wanted
USA’s Most Wanted by Komar and Melamid used a different technique –surveys –to create a painting that catered to the art preferences of the American public.
Source: Dia Art Foundation.

The randomization aspect of this design is explicitly emphasized because randomization is the gold-standard for eliminating biases. Art is a subjective field and evolves over time, and so do the preferences and opinions of customers, clients, or coworkers. A/B testing is not a static process, and tests can be repeated or complemented if companies believe that findings may not be valid or applicable anymore.

Companies like Google, Amazon, and Facebook have all used A/B testing to help create more intuitive web layouts or ad campaigns. Customers benefit and companies can reap measurable monetary returns by catering to market preferences. Momentum is now building to use this method outside of Silicon Valley. Jim Manzi, the founder of Applied Predictive Technologies, has advocated for the use of randomized experiments in other aspects of business, politics, and society in his book Uncontrolled.

As a final note, it is imperative that the design of A/B testing be rigorous to ensure the validity of your results. Furthermore, there may be some decisions where internal opinions are more cost-effective or timely.


Interested to learn more about the technical and conceptual aspects of A/B testing and how it can be used? Take HBX CORe and discover the basics of Business Analytics, Financial Accounting, and Economics for Managers.

Learn more about HBX CORe


anna vallee

About the Author

Anna Vallee is a Research and Teaching Assistant for the Business Analytics course at HBX. She received her Ed.M from the Harvard Graduate School of Education in 2015 where she studied experimental and quasi-experimental research design, applied data analysis, and management practices related to non-profit and educational institutions. Prior to joining HBX, she was the Manager of Research and Data Analytics at another Boston-based edtech startup. A lifelong learner, she is always looking for a great book to read.

Topics: HBX CORe, HBX Insights