<iframe src="https://5923915.fls.doubleclick.net/activityi;src=5923915;type=hbx_core;cat=hbx_b0;dc_lat=;dc_rdid=;tag_for_child_directed_treatment=;ord=1;num=1?" width="1" height="1" frameborder="0" style="display:none">
HBX Business Blog

The Inside Scoop on HBX Admissions 

Posted by HBX on April 25, 2017 at 1:09 PM

Accepted Graphic.png

We sat down with Geri Fox from our admissions team to talk about the HBX application process. Curious what makes for a successful applicant? Read on!

What do you do at HBX? 

My official title is Associate Director of Enrollment Geri-Full.jpgManagement. What that means is that I work closely with the admissions team, product management,and marketing teams to understand 
the qualifications a participant needs to be successful in a particular HBX course. My team then evaluates applicants accordingly.  

What does a normal day look like for you?

For me, a typical day at HBX involves reviewing applications from people who have applied to any of our five programs, tracking how the applicant and registrant pools are shaping up, and keeping a close eye on our yield (the percent of people who register of those we admit). I also spend a great deal of time with our development team planning and testing new functionality to improve our application and administrative systems. 

What makes a good candidate for HBX programs?

A strong candidate for a HBX course is someone with proven academic success who shows determination to get through an intensive course. Candidates should also demonstrate an interest in being a strong community member, willing to share knowledge and help others.

What does the typical HBX student look like?

FullSizeRender.jpgTruthfully, there is no typical HBX student. Our students come from incredibly diverse backgrounds. We have students who are in graduate school, others who are undergraduates, and some who have worked for over 25 years. We have students who come from very different industries and from nearly every country around the world. HBX students are doctors, English majors, engineers, lawyers, IT professionals, and entrepreneurs. Essentially, there is a broad range of people who find value and succeed in our courses.

What does the application process for an HBX course look like?

Our applications vary slightly depending on the course you apply to. Generally speaking, it includes the following:

  • Biographical information: address and phone number
  • Educational history: school attending (or attended) and degrees received
  • Employment information (if applicable): years of work experience, industry, and function
  • Short Essay: up to 300 words in response to a basic open-ended question

How long will it take me to hear back?

geri 1 use this one-678741-edited.jpgYou should expect to receive an admissions decision from us approximately one week after your application is submitted.

Any tips on how to write a great application?

It is important to submit a thorough application and to be as honest as possible. Our goal is to get to know a bit about you through the application and, since we aren’t able to meet in person, this is the next best thing.

Do military members get a discount? How do they note their military status in the application?

Military members and veterans do in fact get a discount. In the application we request proof of military status or proof that you are a veteran. There are clear directions within the application on how to provide documentation.

What's your favorite book?

A Prayer for Owen Meany by John Irving.

Do you have any hidden talents?

I am really good at Dance Dance Revolution!

TV show you never miss?

I never miss a Game of Thrones episode.

Favorite food?

My favorite food is a cannoli from Mike’s Pastry in Boston's North End.

Exploring Company Valuation: Tesla, Ford, and GM

Posted by Brian Misamore on April 21, 2017 at 10:38 AM


Green electric car parked at a charging station

Earlier this week, we analyzed reports of Tesla's market capitalization passing both Ford Motor Company and General Motors, and found that these eye-catching headlines can mostly be explained by the different capital structure of Tesla compared to its older rivals.

Today, we’re taking things a step further and discussing why Tesla might be valued so highly, despite being a very small company. To do this, we’ll need to look at the ratio of Enterprise Value (a finance term meaning the total operational value of the company) to EBITDA, an acronym for Earnings Before Interest, Taxes, Depreciation and Amortization.

EBITDA

When examining earnings, financial analysts generally don't like to look at the raw net income profitability of a company because it's manipulated in a lot of ways by the conventions of accounting, and some of them can really distort the true picture.

To start with, the tax policies of a country seem like a distraction from the actual success of a company - they can vary across countries or across time, even if nothing actually changes in the operational capabilities of the company. Second, Net Income subtracts interest payments to debt holders, which can make companies look more or less successful based solely on their capital structures. That doesn't seem to make sense - so we add both of those back to arrive at EBIT (Earnings Before Interest and Taxes), which we call operating earnings.

Next, we look at depreciation and amortization. In normal accounting, if a company purchases equipment or a building, it doesn't record that transaction all at once - it charges itself an expense called depreciation over time. But the company isn't really spending any money on that depreciation; it isn't real. Amortization is the same thing as depreciation, but for things like patents and intellectual property; once again, no actual money is being spent on this expense.

In some ways, then, depreciation and amortization can take the earnings of a rapidly growing company look worse than a declining company, and that's definitely not right. This sort of distorted picture especially happens to companies like Amazon and Tesla.

Now that we understand how we arrive at EBITDA for each company, we can look at these ratios.

According to the Capital IQ database, Tesla has an Enterprise Value to EBITDA ratio of 36x. Ford's is 15x, and GM's is 6x. So what do these ratios mean?

Present Value of a Growing Perpetuity Formula

One way to think about these ratios is as a part of the growing perpetuity equation. A growing perpetuity is a kind of financial instrument that pays out a certain amount of money every year, and that amount of money grows each year as well. Imagine an annual stipend for retirement that needs to grow every year to match inflation. The growing perpetuity equation allows us to find out today’s value for that sort of financial instrument. Here’s the equation:

Value = Cash Flow / (Cost of Capital - Growth Rate)

So, in our retirement example, someone who wanted to receive $30,000 every year, forever, with a discount rate of 10% and an annual growth rate of 2% (to cover expected inflation) would need $375,000 [30,000/(10%-2%)]. That’s the present value of that arrangement.

What does this have to do with companies? Well, we can imagine the EBITDA of a company as a growing perpetuity paid out every year to the capital holders (both debt and equity) of the company. If a company can be thought of as a stream of cash flows that grow each year, and we know the discount rate (which is that company’s cost of capital), we can use this equation to quickly value the enterprise value of a company.

To do this, we’re going to need some algebra to convert our ratios to this formula. Let’s take Tesla, with an Enterprise to EBITDA ratio of 36x. That means the Enterprise Value of Tesla is 36 times higher than its EBITDA. 

If we look at the growing perpetuity formula and use EBITDA as the Cash Flow and Enterprise Value as the value we’re trying to solve for in this equation, then we know that whatever we’re dividing EBITDA by (the Discount Rate – Growth Rate) is going to have to give us an answer that is 36 times what we have in the numerator. 

Enterprise Value = EBITDA / (1/RATIO)

In other words, the denominator needs to be 1/36, or 2.8%. If we repeat this example with Ford, we would find a denominator of 1/15, or 6.7%. For GM, it would be 1/6, or 16.7%.

The Power of Growth

Plugging it back into the original equation, we know that the percentage is equal to the Cost of Capital - Growth Rate, so we could imagine that Tesla might have a cost of capital of 20% and a growth rate of 17.2%. Or it might have a cost of capital of 13% and a growth rate of 10.2%.

The ratio doesn't tell us exactly, but one thing it does tell us is that the market believes that Tesla's future growth rate will be very close to its cost of capital (unsurprisingly, Tesla's first quarter sales were 69% higher than this time last year).

If we repeat this with GM, we might imagine a cost of capital of 20% and a growth rate of only 3.3% - much less optimistic than Tesla.

In finance, growth is powerful. It explains why, despite being a much, much smaller company, Tesla carries a very high enterprise value. The market has taken notice that, though Tesla is much smaller than Ford or GM in total enterprise value and revenues today, that may not always be the case.


Brian.png

About the Author

Brian is a member of the HBX Course Delivery Team and is currently working on the new Leading with Finance course for the HBX platform. He is a veteran of the United States submarine force and has a background in the insurance industry. He holds an MBA from McGill University in Montreal.

Topics: HBX Insights, HBX Finance

Is Tesla Really Bigger than Ford or GM? Understanding Market Capitalization

Posted by Brian Misamore on April 18, 2017 at 5:16 PM

Tesla Blog Image.png

Since earlier this month, when Tesla's market capitalization passed both Ford Motor Company and General Motors, news organizations have been trying to figure out what to make of the market's consensus. Is Tesla, a young, electric-car manufacturer, really worth more than these behemoth, hundred-year-old automotive powerhouses? How can a company like Tesla with a reported $7 billion in revenue for 2016 possibly be worth more than GM, with $166 billion in revenue?

There are a few things to unpack here, from what market capitalization actually means, to differing capital structures, and reliance on equity.

Market Capitalization

Market capitalization is one of the simplest measures of a publicly traded company's value, calculated by multiplying the total number of shares by the present share price.

Market Capitalization = Share Price x Total Number of Shares

One of the shortcomings of market capitalization is that it only accounts for the value of the equity of the company, while most companies are actually financed by a combination of debt and equity. 

In this case, debt represents investments by banks or bond investors in the future of the company; these liabilities are paid back with interest over time. Equity represents shareholders who own stock in the company, and hold a claim to the future profits of the company. 

So instead of analyzing the companies' market capitalization, let's a look at their enterprise values, a more accurate measure of company value which takes into account these differing capital structures.

Enterprise Values

To find the enterprise value, we’ll combine each company's debt and equity, and remove the amount of cash the company is currently holding in their bank accounts, since that’s not part of their actual operations.  

Enterprise Value = Debt + Equity - Cash

Tesla currently has a market capitalization of $50.5 billion. On top of that, their balance sheet showed liabilities of $17.5 billion (this isn't the market value of their debt, which would be ideal, but it's close enough for this comparison). The company also has around $3.5 billion in cash in their accounts, giving Tesla an enterprise value of approximately $64.5 billion.

We can repeat this exercise for Ford and GM. Ford has a market capitalization of $44.8 billion, outstanding liabilities (again, from their accounting balance sheet) of $208.7 billion, and a cash balance of $15.9 billion, leaving an enterprise value of approximately $237.6 billion. GM has a market capitalization of $51 billion, balance sheet liabilities of $177.8 billion, and a cash balance of $13 billion, leaving an enterprise value of approximately $215.8 billion. 

Hopefully this understanding of enterprise value will provide some context to better understand the sensational headlines you’ve seen in recent weeks. In short, while Tesla's market capitalization is higher than both Ford and GM, Tesla is also financed more from equity. In fact, 74% of their assets have been financed with equity while Ford and GM have capital structures that rely much more on debt (17.6% of Ford's assets are financed with equity, and 22.3% of GM's).

When looking at the enterprise value of each company, it's clear that Ford and GM are still far larger companies than Tesla.

Why stop here? In our next post, we'll look at a key valuation ratio for the three companies to better explain why Tesla's market capitalization might be so high, even though the company is so much smaller than its rivals.


Brian.png

About the Author

Brian is a member of the HBX Course Delivery Team and is currently working on the new Leading with Finance course for the HBX platform. He is a veteran of the United States submarine force and has a background in the insurance industry. He holds an MBA from McGill University in Montreal.


Topics: HBX Finance

Why Airlines Overbook: Using Toy Models to Maximize Revenues

Posted by Ben Chowdhury on April 13, 2017 at 4:11 PM

Full rows of passengers on an airplane

By now, we have all seen the recent news about United Airlines forcibly removing a doctor from an overbooked flight. Almost every major publication has a story on how various airlines handle overbookings and the rules and regulations that come with it (hint: United doesn’t fare so well), but  we wanted to look at the economics behind why airlines overbook.

At first glance, potentially having to pay as much as $1,350 in cash to remove a customer involuntarily from a seat that might have cost far less seems to go against the airline’s best interest. But if we take a more detailed look we can see why every airline overbooks to some extent.

What is a Toy Model?

In economics, we often construct “toy models." These are very simplistic mathematical models that look to explain some economic behavior or phenomenon. In this case, we are considering the revenue generated by a flight and how that revenue changes with varying levels of overbooking.

Let’s consider some of the variables that would go into this model, like:

  • Number of seats
  • Price of each seat
  • Likelihood that these seats will be bought
  • Probability that a customer does not show up
  • The cost of removing someone from a seat that is overbooked (may not be known)
  • How much money customers who do not show up to their flight get refunded
  • Type of flight (destination, length, etc.)
  • And many, many more 

Not only do we not know many of these variables, but our model would get hopelessly complicated. For right now, we want to simplify our model to just a few variables, so we are going to make some very important (and possibly unrealistic) assumptions:

  1. Every seat costs the same price
  2. All seats sell out
  3. The cost of removing someone from a flight is a constant value for each person
  4. Each individual has the same, known, probability of not showing up to a flight

With these assumptions we can create a very simple equation for the revenue of a particular flight.

At its most basic, Revenue = Price * Tickets Sold, where Tickets Sold is equal to the number of Available Seats plus the number of Overbooked Seats.

Cost of Overbooking

But then we have to account for the fact that if more people show up to the flight than there are seats available, the airline will have to pay some customers to leave the flight. We will call this the Cost of Removal. Airlines regularly offer up to $1,350 in cash to customers who are removed from flights. So the equation for the Cost of Overbooking looks like this:

Cost of Removal  * (Overbooked Seats – No-shows) = Cost of Overbooking

Cost of Refunds

Finally, we have to account for the fact that customers who do not show up to their flight are often given a refund of some sort. Maybe it’s 50% of their ticket price, although it could be more or less. So we have to calculate the following:

 Price * No-shows * Refund Rate = Cost of Refunds

Calculating Total Revenue

Given all these factors, we are left with the following equation:

Price * (Tickets Sold) - Cost of Overbooking - Cost of Refunds = Revenue

We can then plug numbers into this model to tell us how much revenue a flight will make. Then we simply pick the level of overbooking that makes the most revenue.

A key point here is that the number of no-shows is not a deterministic number, it varies and the airlines can never know exactly how many people will be no-shows. But since we know the probability that an individual will be a no-show, we can use that to create a distribution of how many no-shows we expect in total. For those of you interested, this would be a Binomial distribution.

Let’s put this model to the test:

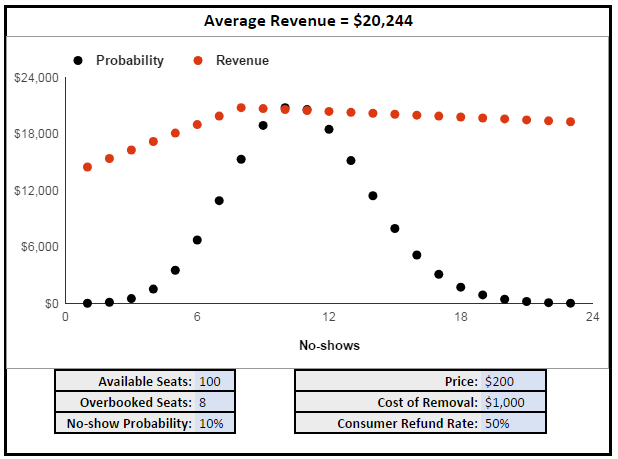
Graph showing how overbooked seats and no shows affect airline revenues

In the example above, the optimal number of overbooked seats for this flight is eight. If the airline were to increase or decrease that number, the average revenue would go down. For example, if the airline did not overbook at all, revenues would decrease to an even $19,000.

It turns out that even if we increase the cost of removal to something very high (say $100,000) it still makes sense for the airline to overbook (just to a lesser extent). Of course, this model doesn’t take into account other repercussions of overbooking and removing customers (like public relations scandals and impact on future demand for flights). This is a toy model after all!

Try It For Yourself

Feel free to adjust the numbers in the model to see how it affects the overall revenue and number of overbooked seats necessary to maximize profits.

The black data points represent the binomial distribution we talked about earlier, the probability that we will see a specific number of no-shows. The red data points represent the amount of revenue generated with that number of no-shows. The average revenue multiplies these values and adds them up. 


About the Author

BlogRound_ben.pngBen is a member of the HBX Course Development Team and works on the Negotiation Mastery and Economics for Managers courses. He has a background in economics and physics and enjoys card games, cooking, and discussing philosophy.


I'll have what's she's having: How what you eat can foster trust and agreement

Posted by Professor Mike Wheeler on April 12, 2017 at 12:25 PM

Two people sit across from each other in a coffee shop with drinks, pastry and a notepad between them

Two University of Chicago psychologists, Kaitlin Woolley and Ayelet Fishbach, recently ran a set of experiments to see whether what people eat impacts trust and cooperation.

What the researchers discovered surprised me. And it should be food for thought for you next time you go to the bargaining table.

Woolley and Fishbach paired up 124 subjects—all strangers—to do a labor relations exercise that I assign in my MBA Negotiation course at Harvard Business School. Under the rules parties have to go through successive rounds of concessions to narrow the gap between management’s offer and the union’s demands. (Their article is forthcoming in the Journal of Consumer Psychology.)

The researchers added what might seem like an innocuous twist. With one group, they gave each negotiator sweets (Tootsie Rolls or a cookie). For another group, each negotiator got salty food (potato chips or pretzels).

Don’t jump to conclusions. You might have guessed that the candy sweetened up the first group, so that they reached agreement faster than the group that got the salty snacks. Nope. There was virtually no difference in how those two grounds negotiated.

But the experimenters had also a created a third group, where one negotiator in each pair was given sweet food and the other got something salty. These mismatched pairs took twice as long to reach agreement than the pairs in the first two groups who ate the same thing. It wasn’t merely that the pairs who ate different food wasted time. Under the rules of the game, the subjects lost real money! Everyone had been told in advance that the longer they took to resolve the dispute, the less they’d be paid for doing the experiment.

Remember, nobody in any group got to choose what they ate. It was entirely random. So this wasn’t a case of people with similar tastes somehow bonding together. The similarity (or difference) in the food people were given to eat was entirely subliminal. Nevertheless the impact on the negotiation process was significant.

What’s going on here? And what does it mean for us next time we negotiate in the real world?

Woolley and Fishbach relate their experiments to a broader body of research on social mimicry. Studies have shown, for example, that mirroring other people’s gestures and expressions can foster trust and bolster persuasion (though it must be done subtly). Parallel work on verbal mimicry likewise suggests that trust can be enhanced by speaking at the same rate as your counterparts and repeating some of the words that they use.

These effect are real, but don’t go overboard. At a business lunch, you’re not guaranteed to win over a prospective client merely by ordering the same drink or meal that she does. She has to perceive value what you propose and be convinced that you can deliver on your promises.

But in the back of your head you should be monitoring how well you two are connecting. Whether or not you’re in sync is a function of your particular personalities, emotions, and behavior. It’s what each of you do and say—and how each of you reads the other.

Woolley and Fishbach add to the evidence that interpersonal connection is more than that. External factors come into play, as well. Cooperation is also influenced by whether the sun shining or what music is playing in the background. Those kind of atmospherics are beyond our control, of course. If anything, though, that’s an argument for giving greater attention to those things that we can do to improve trust and cooperation.

So, after the server has taken your prospect’s order (and it’s something palatable), it wouldn't hurt to say, “You know, that sounds good. I’ll have that, too.”

This article was originally published on LinkedIn Pulse.


Professor Mike Wheeler

About the Author

Professor Mike Wheeler's current research focuses on negotiation dynamics, dispute resolution, ethics, and distance learning. He is the author or co-author of eleven books, and his self-assessment app—Negotiation360—was released early in 2015. Additionally, Professor Wheeler's new HBX course, Negotiation Mastery: Unlocking Value in the Real World, is now accepting applications.

Topics: HBX Insights, Negotiation

A Beginner's Guide to Understanding Your Taxes

Posted by Jackie Merriam on April 6, 2017 at 4:18 PM

A Beginner's Guide to Understanding Your Taxes - Frightened man clutching money runs away from a dog in a TAX sweater

If you live in the United States, it’s that time of year again! Have you filed your taxes yet? April 18 is the filing deadline for individual income tax returns (Procrastinators, rejoice! You have three extra days to file this year).

While the various tax forms, rules, and regulations can be confusing, the basic tax formula is actually pretty simple. If you break it down, your tax refund or the tax you have to pay is calculated like this:

Total Income - Deductions = Adjusted Gross IncomeAdjusted Gross Income - Exemptions - Standard or Itemized Deducions = Taxable IncomeTaxable Income x Tax Rate = TaxTax - Credits = Total Taxes OwedTotal Taxes Owed - Taxes Already Paid = Refund Amount


Seems easy enough, right? But what do each of those terms actually mean? 

Total Income vs. Adjusted Gross Income (AGI) vs. Taxable Income

There are many “income” amounts that appear on your tax forms.

Total Income simply represents all the money that you made in compensation during the year—whether that was from your employer, through investment interest, or other forms of compensation.

Adjusted Gross Income (AGI) is the amount of money that you made this year, less any specific deductions.

Taxable Income is the amount that you will use to calculate your tax.

Deductions vs. Credits

Deductions and credits are very similar, in that they both reduce your tax, but how and when they reduce your tax differs.

Deductions are amounts that you subtract from your income, and are taken out before you calculate the total tax owed.

Credits are amounts that are taken out after you have already calculated your tax, so they reduce your tax directly. Credits are generally more beneficial than deductions because they reduce your tax directly dollar-for-dollar, whereas deductions reduce your taxes indirectly by reducing your income.

To illustrate this, let’s take a simple example. Say that you made $100 this year, and your tax rate is 10%. Let’s say that you have an option to take a $15 deduction or a $15 credit. These two options can be illustrated with the formulas below:


  Deduction Option

  Credit Option 

Total Income      $100    $100 
–  Deductions       -   $15        -   $0  


AGI      $85      $100 
         
Tax (AGI x 10%)      $8.50     $10 
–  Credits    $0   $15 


Total Tax      $8.50     $5 refund

In this example, if you take the credit you actually don’t owe any tax, but if you take the deduction you would owe $8.50 of tax. This simple illustration shows that credits are (almost always) more beneficial than deductions.

Why do credits and deductions exist? Well, it isn’t because the government wants to reduce your tax liability out of the goodness of their heart. They exist because the government is trying to incentivize certain behavior. For example, they want people to pursue higher education, so there are tuition deductions and credits and student loan interest is deductible.

Standard vs. Itemized Deduction

While all other deductions apply to people differently, every tax payer is entitled to either the Standard or Itemized Deduction.

The Standard Deduction is a set amount that every tax payer can subtract from their income. The amount varies depending on your filing status, but it is adjusted each year to account for inflation.

Taxpayers also have the option to itemize their deductions. Itemized Deductions are the total of specific amounts, including medical and dental expenses, amounts given to charity, amounts lost to theft, taxes and interest paid, and any job expenses that were not reimbursed by your employer.

If the total of all these amounts is greater than the standard deduction amount, you should itemize your deductions. If the total of these amounts is less than the standard deduction, you should take the standard deduction.

Part of the reason that the standard deduction exists is because, for most people, the things that are included on the itemized deduction list are often hard to track and value. For example, giving a box of clothing to your local charity is deductible, but the value of that clothing is often subjective and hard to determine. You also may give small amounts of money to charities here and there that would be hard to track over the year.

Under this system, taxpayers can still take a deduction, without having to worry about tracking every dollar. IRS data indicates that roughly 30% of Americans itemize their deductions, and high-income taxpayers are more likely to itemize.

Exemptions

Each taxpayer who is not claimed as a dependent can claim a personal exemption. Taxpayers can also claim an exemption for each person that they list as a dependent. The exemption is a standard amount that reduces your adjusted income.

To determine your exemption, simply count the number of dependents that you claim (including yourself and your spouse) and multiply it by the exemption amount. Exemptions reduce your income to account for the fact that you have to pay money to take care of yourself and attempt to align the tax amount with a household’s ability to pay tax. 

There are hundreds of pages of rules and regulations in the Internal Revenue Code, and it changes constantly, but these simple terms will help you to better understand your return.


About the Author

Jackie Blog Round.pngJackie is a member of the HBX Course Delivery Team and currently works on the Financial Accounting course for the Credential of Readiness (CORe) program. She also works on the Leading with Finance Course, and is working to design and develop a course in Entrepreneurship for the HBX Platform.

Jackie holds a BSB in Accounting in Finance, and a Masters of Accountancy, all from the University of Minnesota. In her free time she enjoys cheering on her favorite Minnesota sports teams and baking.

Topics: HBX CORe, Financial Accounting

How to Analyze a Dataset

Posted by Melissa Barton on April 5, 2017 at 8:30 AM

dataset.png

We live in a world where 2.5 billion gigabytes of data are created every day. Rich data can be an incredibly powerful decision-making tool for organizations when harnessed effectively, but it can also become daunting to collect and analyze such large amounts of information.

Here are a few important things to keep in mind when diving into your next data analytics project:

1. Never assume that your dataset is clean

Clean, clean, clean. Data cleaning is the process of uncovering and correcting, or potentially eliminating altogether, inaccurate or repeat records from your dataset. It is imperative that you work through this step first before beginning any analysis. This is particularly important if you will be presenting your findings to business teams who will be using it for decision making purposes. Teams need to have confidence that they are acting on a reliable source of information.

2. Start with a specific question and hypothesis

Once you’ve completed the cleaning process, you may find yourself looking at the dataset with a number of questions swirling in your head. There is so much potential analysis in front of you! Just be cautious and proceed slowly. Don’t try to tackle too much at once. Make sure that you are beginning your analysis with a very focused and specific question.

If the request for analysis is coming from a business team, push them to provide explicit details around what they are hoping to learn, what they expect to learn, and how they will use the information. This might also mean that you can actually eliminate some unnecessary variables in the dataset to make sure that your analysis remains on track.

3. Don’t be biased by having a hypothesis in mind

Fantastic, your dataset is clean and you have narrowed in on a specific question! Next, make certain that you remain unbiased as you make inroads with your analysis. Many analysts will tell you that it can be tempting to use data to tell the story that you or your colleagues want or expect to hear.

But, you have to let the dataset speak for itself. Keep yourself alert to the fact that maintaining objectivity is not as easy as it sounds. It’s okay if the data isn’t telling you what you are expecting to hear because that’s a finding in and of itself!

4. Documentation is key

I find it useful to retain a log of my data analysis for various reasons. First, it is a place where I can discuss any limitations or special circumstances that I encountered along the way. Second, a colleague can more easily review and/or critique the analysis by having this guide.

Finally, in the case that my analysis will be replicated with an updated or new dataset, then I can be confident that it is conducted in a way that allows for a true comparison with the prior work.   

5. Always investigate the whys

Finally, as you near the conclusion of your analysis, remember that this dataset is only one piece of the puzzle. It is critical to pair your quantitative findings with qualitative information, which you may capture using questionnaires, interviews, or testimonials. While the dataset has the ability to tell you what is happening, the qualitative information can often point you in the direction of why it is happening.


headshot of Melissa Barton

About the Author

Melissa Barton is a Research and Planning Analyst at HBX, providing data, research and analysis to inform strategic decision making. She received her MBA from Harvard Business School in 2014, and prior to joining HBX, she was a Business Consultant at a Boston-based consumer insights & innovation firm. Outside of work, she can be found spending time with family, golfing, running or catching a movie.

How Do Companies Keep Track of Their Monies?

Posted by Christine Johnson on March 28, 2017 at 3:01 PM

accounting.png

From small mom-and-pop shops to multi-million dollar corporations, knowing who you’ve paid or who owes you is vital for a successful operation.

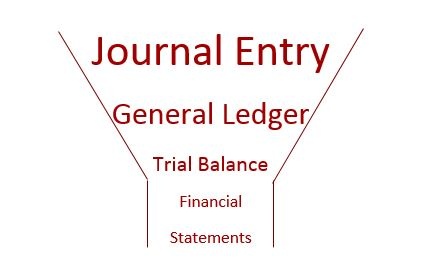
Here is an overview of how companies use accounting to keep track of their money.

process flow.jpg

Journal Entry

When a company has a transaction (i.e. buys a piece of equipment, sells inventory to a customer, etc.), they will record this transaction by creating a journal entry. The journal entry shows the date, the accounts that are involved with the transaction, as well as the amounts of money.

Below is an example of a journal entry. There are two accounts involved in this journal entry, Accounts Payable and Cash, and there are two amounts, $900 and $900. Notice that those amounts are the same—this should always be the case! Depending on the size of the company, there can be hundreds, thousands, and even millions of journal entries made each year!

journal entry.jpg

General Ledger

Have you ever heard the phrase ‘on the books’? This is referring to a company’s general ledger, which used to be a large, hand-written book containing all of the financial accounts of an organization. The general ledger is basically like the diary of a company, showing a chronological listing of transactions.

Below is an example of what a general ledger used to look like. Thankfully, most of this is done on computers now!

general ledger.jpg

Trial Balance

The trial balance contains a listing of a company’s financial accounts along with their balances. It’s a tool that helps check the clerical accuracy of transactions that have been recorded to date. As its name suggests, it’s a trial or a test to see if all of the entries add up, or balance, properly before creating the financial statements.

Financial Statements

Financial statements are prepared reports that represent the financial operations of a company. They can be used internally by managers to make strategic decisions; they can be used externally by stakeholders to make investment decisions. The most commonly known financial statements are the Balance Sheet, The Income Statement, and The Statement of Cash Flows.

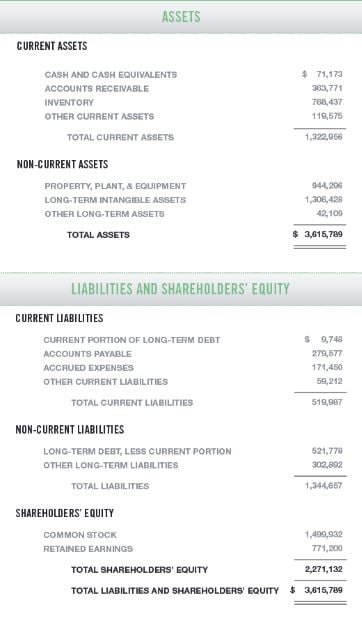
The Balance Sheet shows a company’s assets, liabilities, and shareholders’ equity for a given point in time (usually year-end).

balance sheet.jpg

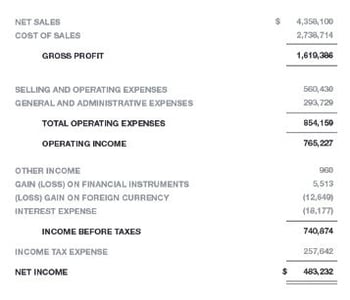
The Income Statement summarizes the revenues and expenses over a given period of time (usually one year).

income statement.jpg

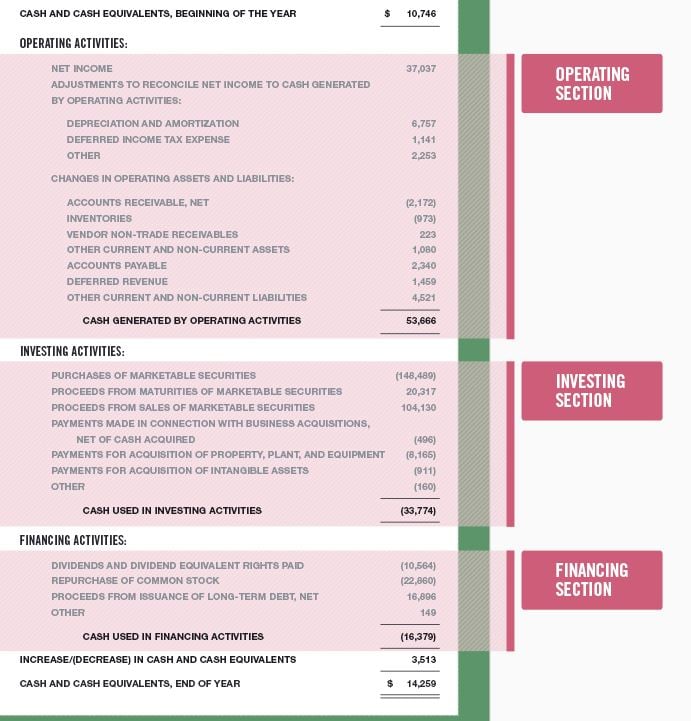
And, The Statement of Cash Flows summarizes a company’s cash flows related to operating, financing, and investing activities.

statement of cash flows.jpg

process flow.jpg

It can be helpful to think about this accounting process like a funnel. As we move down, the information gets less detailed and more concentrated.

funnel.jpg

Each of these processes play an important part in accounting and help businesses to understand, track, and improve how they earn and spend money.


Interested in learning the language of business? Take HBX CORe and discover the basics of Economics for Managers, Financial Accounting, and Business Analytics.

Learn more about HBX CORe


christine

About the Author

Christine is a member of the HBX Course Delivery Team, focusing on Financial Accounting and Disruptive Strategy. She holds a B.S. in Management from UNC Asheville, an M.S. in Accounting from Northeastern University, and an MBA from Northeastern University. In her spare time, she enjoys reading business journals and watching NFL games.

Topics: Business Fundamentals

5 Tips for Tackling Productivity in an Open Office

Posted by Stephanie Jones on March 23, 2017 at 10:21 AM

Open-Office.jpg

With startups, technology companies, and even century-old corporations moving toward open workspaces instead of private offices, it is no surprise that some employees are less than thrilled with the arrangement. Modernist architects originally devised the open office concept as a way to breed collaboration and increase organizational awareness in the 1950s, but some would argue that it has resulted in frequent interruptions and reduced employee productivity at a time when technology has enabled us to do far more in less time.

While many companies are re-evaluating their decisions to be wall-free, roughly 70 percent of workers in the United States currently report to an open office daily according to the International Facilities Management Association.

Here are five tips to stay productive in an open office environment (even as your co-workers are busy scheduling their dentist appointments and recapping their weekend plans):

1. Invest in good headphones

If your employer allows it, the easiest solution to your productivity woes it to purchase noise canceling headphones. Music can increase focus and headphones often signal that you’re not open to interruption. Prices vary greatly so do your research and find a pair that best fits your needs.

Some employers even have budgets for staff supply requests, so consider asking your employer if they are willing to purchase or subsidize your productivity efforts.

2. Create a routine and stick to it 

Establishing and sticking to routine allows you to maximize your time spent in the office. Carve out established times to work on projects and “Office Hours” where you are at your desk and available to collaborate. Discuss your plans with your team and watch yourself chip away at that to-do list you’ve been avoiding all week.

3. Seek out quiet space in the office 

With recent studies suggesting open office spaces hinder productivity, companies are beginning to diversify their spaces. If you are fortunate to work in an office that has conference rooms, seating areas, or lounges, be sure to seek these spaces out when you need interruption-free time away from your desk to complete your work. If you do not have designated spaces like these, be sure to step out of the office for coffee or lunch to help refresh your mind and refocus.

4. Discuss your work style with your team and manager 

It is no secret that everyone has different work styles. While some may be okay getting tapped on the shoulder when absorbed in a task or can completely tune out conversations and background noise, others may find this brings their work flow to a halt. Open communication can help avoid unproductive resentment or frustrations with co-workers who may have different work styles.

When joining a team or working for a new manager, be sure to let them know how you prefer to work. Similarly, it makes sense to revisit the topic when someone new joins your team so you can reaffirm or adjust team norms. By discussing work styles openly, you can strengthen relationships with your co-workers and have more productive work days.

5. Set boundaries

The most important open office productivity tip is to set boundaries. Set boundaries for when you are going to socialize with you co-worker about weekend plans. Set boundaries around the lunch hour as a mid-day break enabling afternoon focus. Set boundaries on what hours you are open to holding meetings. While you may feel cold turning away someone who has come to you looking for an answer, the biggest detriment to work flow is allowing others to determine how you spend your time.

Evaluate your company’s culture, and see if placing a “Do Not Disturb” sign on your desk or asking someone to come back later makes sense while you are chipping away on a project. Pop in your headphones and let your team members know you need the next hour to complete a task.

You will find that setting boundaries allows you to be more productive. You may even end up with more time to get to know your co-workers or schedule that dentist appointment you’ve been avoiding.


Steph_bloground.png

About the Author

Stephanie Jones is HBX's Business Operations Specialist. She onboards new HBX team members and enjoys serving as a team resource for all things operations. Stephanie graduated from Bryant University’s International Business Program in 2015 and aspires to work internationally in the future. When she’s not welcoming new team members and arranging staff events, Stephanie can be found on the Cape enjoying the beach or hiking in Vermont with her two terribly behaved terriers.

Topics: HBX Insights

Get to Know Professor Mike Wheeler

Posted by HBX on March 21, 2017 at 11:08 AM

mike-at-blackboard.png

We recently sat down with Harvard Business School and HBX Negotiation Mastery Professor Mike Wheeler to talk about negotiation, close encounters with sharks, and his internal timekeeping superpower.

What’s the biggest misconception about negotiation?

That it's an innate skill - something that you're either born with or that you'll never have. That's ridiculous!

The hardest part about developing my HBX course was ______________.

Making sure the passion that my colleagues and I have for negotiation is understood, and ultimately shared by, the students who will take our course.

What’s your favorite part of your job?

I love learning from my students, especially when they spot issues or raise questions I hadn't anticipated.

Finish this sentence: When I’m not at work, you can find me _________________.

In my hometown of Gloucester, MA, where I still see friends I went to kindergarten with years ago.

Mike Wheeler Sailing on a boat

How would you describe yourself?

I'd say that I'm curious, optimistic (for the most part), and a bit of a contrarian.

What’s your personal motto?

“For every complex problem, there is a solution that is simple, neat, and wrong.”

– Journalist and essayist H.L. Mencken

What's the best book you’ve ever read?

Right now I'd say Sarah Bakewell's How to Live: Or A Life of Montaigne in one Question and Twenty Attempts at an Answer.

What was your favorite subject in school?

I was an American Studies major in college. I loved the mix of history, literature, economics, and the arts (and still do)!

Where do you get your news from?

An eclectic mix of sources. I probably spend less time than most people on so-called breaking news. I'm more interested in longer-term developments.

What’s the most unusual or interesting job you’ve ever had?

In the summers when I was in high school and college, I worked on a commercial tuna boat. The striker would harpoon these giant fish (mostly 500-800 pounds). Then, another guy and I would be put into a dory to haul them in. I've had some interesting encounters with whales and one particular shark.

Mike as a Cornell hockey player in the movie Love Story

People would be surprised if they knew ______________.

If you look quickly, you can spot me in the movie Love Story as a Cornell hockey player.

Do you have a hidden talent?

It's not exactly a talent, and it's both weird and utterly worthless: when I wake up in the morning, I usually know what time it is almost to the minute without looking at a clock.

If you could travel anywhere in the world (that you haven’t yet been) where would you go?

Sailing around Cape Horn - though I'm mindful of the adage, "Be careful what you wish for."

What's the best advice someone has ever given you?

A professor in college, Henry Steele Commager, told me, "Do what you most love, and everything else will take care of itself."


Want to learn from Professor Wheeler? Apply to his new HBX course, Negotiation Mastery: Unlocking Value in the Real World.

Learn More